
NoDerog
ProShares S&P Technology Dividend Aristocrats ETF (BATS:TDV) offers exposure to high-quality, established tech dividend growth stories. It has been a while since I covered this investment vehicle. The previous note was published in April 2021, during the heyday of the capital rotation and almost a year before the beginning of one of the most aggressive tightening cycles in U.S. history. Since then, despite numerous headwinds, especially during an unquestionably challenging 2022, TDV has delivered a rather solid total return of 8.8%.
Seeking Alpha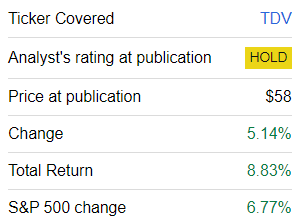
The purpose of today’s note is to review TDV’s current portfolio composition and its exposure to style factors, including value, growth, and quality, to decide whether the ETF deserves a more optimistic rating this time than just a Hold.
TDV’s strategy: leading tech dividend growth stories
According to the ProShares website, TDV’s investment mandate since its inception in November 2019 has been tracking the S&P Technology Dividend Aristocrats Index. The strategy revolves around resilient, durable dividend growth stories in the tech sector. More specifically, the benchmark
targets companies from information technology, internet and direct marketing retail, interactive home entertainment, and interactive media and services segments of the economy. To be included in the index, a company must have increased dividend payments each year for at least seven years, and its shares must be listed on a U.S. national securities exchange and meet certain minimum liquidity and other requirements.
All the constituents are assigned equal weights, likely to insure adequate diversification and avoid unnecessary disproportions in exposure, which, in turn, could skew returns. Importantly, the index must contain at least 25 stocks, and in case the target cannot be reached, the dividend growth criterion is relaxed. The benchmark is rebalanced four times a year (January, April, July, and October); it is reconstituted only in January.
The factor story
As of October 31, the TDV portfolio consisted of 37 stocks, with the major holding being International Business Machines (IBM), with a 2.9% weight. Assuming it has been more than two and a half years since the previous coverage, TDV has not changed much. More specifically, my calculations showed that the portfolios have around 81% overlap as 7 holdings were added since April 2021, while 8 were removed.
What does TDV offer in the current iteration regarding factors? I see a slight value tilt and excellent quality, yet rather subdued growth.
| Metric | 31-Oct |
| Market Cap | $224.86 billion |
| EY | 5.17% |
| EBITDA/EV | 6.26% |
| Cash Flow/Price | 5.32% |
| P/S | 5.02 |
| EPS Fwd | 5.46% |
| EBITDA Fwd | 4.55% |
| Revenue Fwd | 5% |
| ROA | 12% |
| ROE | 38.4% |
| ROTC | 15.6% |
| FCF Margin | 17.9% |
Calculated using data from Seeking Alpha and the fund. Financial data as of November 1
- Uncoincidentally, with the two members of the $2 trillion league present, namely Apple (AAPL) and Microsoft (MSFT), TDV has a weighted-average market cap of close to $225 billion, even despite its significant exposure to the small & mid-cap echelons (26.7%). Technically, there is even one micro-cap in the mix, Cass Information Systems (CASS), a 6% yielding stock with around $108.3 million in market cap (as of November 1).
- Obviously, an earnings yield of 5.17% looks healthy for a tech-centered equity mix, especially since the iShares Core S&P 500 ETF (IVV) is offering only ~4.7%, while the Invesco QQQ Trust ETF (QQQ) is trading with an even thinner EY of ~3.7%.
- To give a bit more color on which components did contribute to this result, I should mention Avnet (AVT) and Vishay Intertechnology (VSH), which have an 18.2% and 13.6% EY, respectively.
- Besides, EBITDA/Enterprise Value (sometimes referred to as a ‘debt-adjusted earnings yield’) and the cash yield both also look more than adequate.
- However, I still see an issue here. More specifically, less than 22% of the holdings have a B- Quant Valuation grade or higher, while 62.4% are comparatively overvalued. I believe this is too small, assuming all the uncertainty regarding interest rates.
- A 5x Price/Sales ratio also looks uncomfortable, considering the IT sector has a median of 2.36x.
| Parameter | 31-Oct |
| Quant Valuation B- or higher | 21.6% |
| Quant Valuation D+ or lower | 62.4% |
| Quant Profitability B- or higher | 91.7% |
| Quant Profitability D+ or lower | None |
- It is essential to note that TDV does deliver an excellent quality story, with none of the holdings having a Profitability grade weaker than C. Portfolio-wise capital efficiency indicators are also telling, especially the Return on Total Capital of 15.6%.
- FCF is of paramount importance for dividend-growth portfolios. And here, TDV can justly be proud of its weighted-average FCF margin. Meanwhile, just 3 companies are FCF-negative: CASS, AVT, and Texas Instruments (TXN).
- Alas, growth is mostly a disappointment, with forward EPS, EBITDA, and revenue growth rates only in the mid-single digits. A few detractors to mention are Cognex Corporation (CGNX), which is forecast to deliver a 10% decline in EBITDA, and Power Integrations (POWI), with its 5.3% anticipated revenue decline.
Examining the dividend credentials
Dividend investors who favor consistency and growth will be pleasantly surprised by TDV’s portfolio. However, those seeking market-leading yields to boost their income would likely give the ETF a cold shoulder. The reasons are presented below:
| Yield TTM | 3-Year Div CAGR | 5-Year Div CAGR |
| 1.94% | 10.51% | 11.95% |
Calculated using data from Seeking Alpha and the fund
Certainly, a weighted-average yield of less than 2% is simply diminutive for the current environment, even assuming the portfolio offers double-digit dividend CAGRs, bolstered by companies like Microchip Technology (MCHP).
| Stock | Weight | 3Y Div |
| Microchip Technology (MCHP) | 2.6% | 26.28% |
| Power Integrations (POWI) | 2.7% | 22.80% |
| Amphenol (APH) | 2.8% | 18.88% |
| Oracle (ORCL) | 2.8% | 16.55% |
| Lam Research (LRCX) | 2.7% | 15.97% |
Expectedly, almost 84% of the holdings have a B- Quant Dividend Growth grade or stronger. Roper Technologies (ROP) has the longest dividend growth story in the group: in November 2022, it notched its 30th year of consistent DPS increases.
More on performance
During the December 2019–October 2023 period, TDV delivered a total return that was nothing short of strong, as it solidly beat both the ProShares S&P 500 Dividend Aristocrats ETF (NOBL) and IVV, partly thanks to its exceptional performance in 2020.
| Portfolio | TDV | IVV | NOBL | QQQ |
| Initial Balance | $10,000 | $10,000 | $10,000 | $10,000 |
| Final Balance | $15,484 | $14,204 | $12,389 | $17,528 |
| CAGR | 11.81% | 9.37% | 5.62% | 15.41% |
| Stdev | 21.42% | 19.42% | 19.01% | 23.17% |
| Best Year | 29.02% | 28.76% | 24.63% | 48.40% |
| Worst Year | -15.92% | -18.16% | -6.51% | -32.58% |
| Max. Drawdown | -23.60% | -23.93% | -23.23% | -32.58% |
| Sharpe Ratio | 0.55 | 0.47 | 0.29 | 0.66 |
| Sortino Ratio | 0.88 | 0.71 | 0.44 | 1.07 |
| Market Correlation | 0.96 | 1 | 0.93 | 0.91 |
Data from Portfolio Visualizer
It was unable to keep pace with QQQ. Nevertheless, the Nasdaq-100 index-tracking fund still had a higher standard deviation than TDV, a significantly deeper max drawdown, and much weaker performance in 2022 (its worst year in the period, a 32.58% decline).
Final thoughts
TDV is an excellent option for investors seeking dividend durability, consistency, and growth in a tech-heavy portfolio. Its constituents have excellent capital efficiency and mostly copious free cash flows. The total returns it delivered in the past are worth appreciating.
The key issue with this vehicle is insufficient value exposure, which is already evident from the dividend yield of just 1.42%. So, TDV is more of a total return play for investors favoring top-quality tech stories. However, they should understand that a 45 bps expense ratio will consistently eat into returns.
All things considered, I prefer to remain on the sidelines this time, with a conservative Hold rating maintained.