
The Request (REQ) price increased by 80% on October 10 and nearly reached a new yearly high the next day.
The increase caused a breakout from a long-term descending resistance trendline. Can the price push to a new 2023 high?
Request Attempts Breakout From Long-Term Pattern
The REQ price has fallen under a descending resistance trendline since May 2022. The decrease led to a low of $0.061 in August.
The low was important since it caused a breakdown from the $0.070 horizontal support area. The area had previously provided support since June 22.
Despite the alleged breakdown, the altcoin regained its footing shortly afterward and began an upward movement on October 10, increasing by 80%.
The increase took the REQ price well above the descending resistance trendline and led to a high of $0.122. The high is slightly below the yearly high of $0.129.
The cryptocurrency could not sustain the increase and is in the process of creating a long upper wick (red icon) in the weekly timeframe.
Such a wick is considered a sign of selling pressure since it shows that sellers took over after buyers could not maintain the increase.
REQ Price Prediction: Is New Yearly High on the Cards?
The daily timeframe analysis gives a bullish outlook for the cryptocurrency.
The first reason for this comes from the RSI. When evaluating market conditions, traders use the RSI as a momentum indicator to determine if a market is overbought or oversold and to decide whether to accumulate or sell an asset.
If the RSI reading is above 50 and the trend is upward, bulls still have an advantage, but if the reading is below 50, the opposite is true.
The indicator is increasing and above 50, both signs of a bullish trend.
Moreover, the entire REQ price increase preceded a bullish divergence in the RSI. Such a divergence occurs when a momentum increase accompanies a price decrease. It is often associated with bullish trend reversals.
The price action is also more bullish since REQ has closed above the descending resistance line in the daily timeframe. This legitimizes the ongoing breakout.
In order to reach the $0.120 resistance area again, REQ has to increase by another 30%.
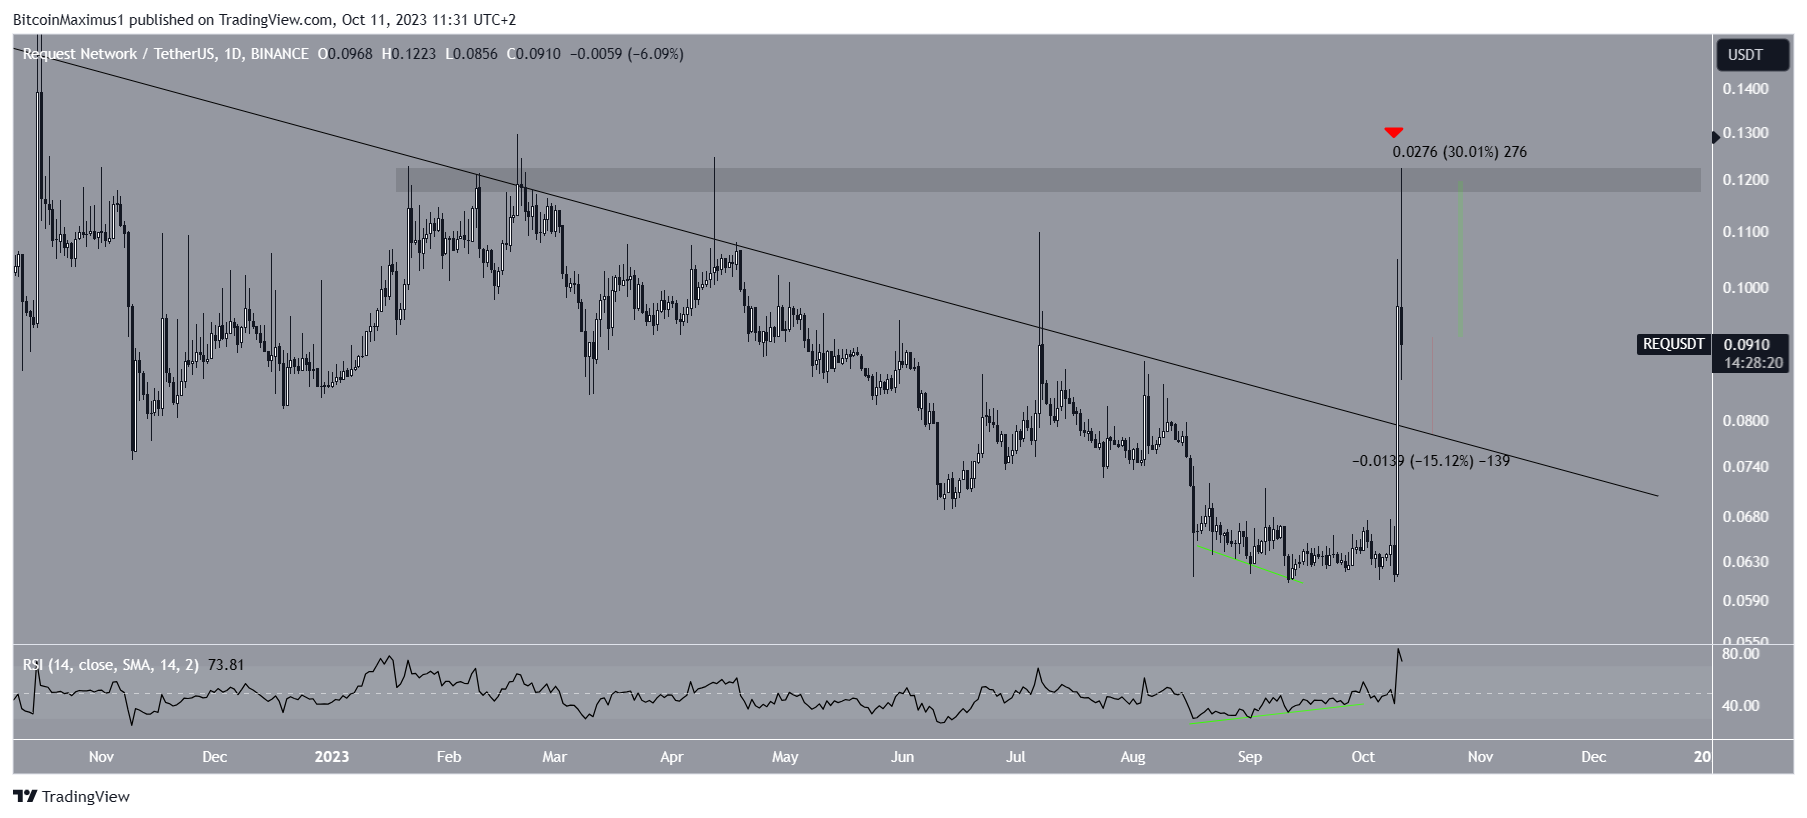
Despite this bullish REQ price prediction, creating a bearish daily candlestick can lead to a 15% drop to the descending resistance trendline, which is currently at $0.076.
For BeInCrypto’s latest crypto market analysis, click here.
Disclaimer
In line with the Trust Project guidelines, this price analysis article is for informational purposes only and should not be considered financial or investment advice. BeInCrypto is committed to accurate, unbiased reporting, but market conditions are subject to change without notice. Always conduct your own research and consult with a professional before making any financial decisions.