
DNY59
We previously covered Citigroup Inc. (NYSE:C) in July 2023, discussing its bright prospects thanks to TTS’ role as a crown jewel of the bank’s global network, potentially boosting its valuation moving forward.
We had ended the article with a Buy rating then, attributed to its expanded forward dividend yields, thanks to its depressed stock prices.
In this article, we will be discussing C’s excellent revenue growth in the TTS segment, which has been negated by the minimal profitability tailwinds despite the elevated interest rate environment.
It appears that the Fed’s hike thus far has only masked its very slow turnaround story, with the bank’s RoTCE reversal likely to take longer than expected.
We shall discuss further.
The TTS Growth Investment Thesis Remains Robust, Despite Not Translating To Its Profitability
In the FQ3’23 quarter, C reported another excellent update for the Treasury and Trade Solutions segment, with it generating revenues of $3.59B (+2.2% QoQ/ +12.1% YoY).
Since the segment comprises a large portion at 17.8% (-0.2 points sequentially/ +0.6 point YoY) of its overall revenues of $20.13B (+3.6% QoQ/ +8.8% YoY), it is evident that TTS is one of its “fastest-growing business,” well exceeding its previous Investor Day revenue CAGR target of high single digits.
While part of the growth is attributed to the elevated interest rates, it is apparent the Fed’s hikes have been relatively kind to C, with an overall Net Interest Income [NII] of $13.82B (-0.5% QoQ/ +10% YoY) and overall Net Interest Margin [NIM] of 2.49% (+0.01 points QoQ/ +0.18 YoY).
Then again, Mr. Market’s pessimism is attributed to its underwhelming prospects, with its YTD RoTCE of 8.3% still lagging behind FY2019 levels of 12.1%, despite the excellent prospects from the elevated interest rate environment.
Perhaps this is partly attributed to TTS’ high volume low margin business model, with C’s FQ3’23 RoTCE of 7.7% still lagging way behind its Big Bank peers, such as JPMorgan Chase (JPM) at 22%, Bank of America (BAC) at 15.5%, and Wells Fargo (WFC) at 15.9% in the latest quarters.
This is compared to their FY2019 levels of 19%, 14.86%, and 12.2%, respectively, implying that C may be only one that has failed to generate alpha from the elevated interest rate environment.
Therefore, while the C management has guided excellent growth and innovation for the TTS segment, it is unsurprising that Mr. Market is not that impressed, since the robust client activities do not translate to improved profitability:
We continue to see healthy underlying drivers in TTS that indicate consistently strong client activity with cross-border flows up 16%, outpacing global GDP growth and year-to-date, cross-border flows were up 12%.
So deeper client relationships, more growth in terms of new clients that fit with our proposition fairly uniquely and some great megatrends that we are going to be riding and pretty uniquely positioned on… our win rate is 82% in TTS. (Seeking Alpha)
In addition, while the C management has long iterated a medium term RoTCE target of between 11% and 12%, it remains to be seen when we may see this achieved, due to the massive gap from its current performance.
With the US 10Y Treasury Yield already near 5%, we may see the bank’s total deposit base further decline from current levels of $1.27T (-3% QoQ/ -2.7% YoY) as well, similar to that of the US Big Banks, as more consumers/ investors flock to the Treasuries for safety and higher returns.
While the elevated interest rate is expected to normalized from 2024 onwards, we may see C’s RoTCE target temporarily delayed, potentially elongating the stock’s recovery.
C Valuations
Seeking Alpha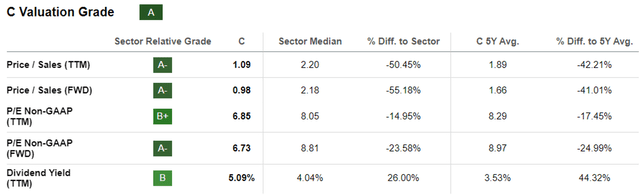
Perhaps this is why C’s FWD P/E valuation of 6.73x appear to be impacted compared to its 5Y means of 8.97x, JPM’s P/E of 8.86x, BAC’s P/E of 7.86x, WFC’s P/E of 8.16x, and sector medians of 8.81x, demonstrating Mr. Market’s pessimism about its profitability prospects.
The Consensus Forward Estimates
Tikr Terminal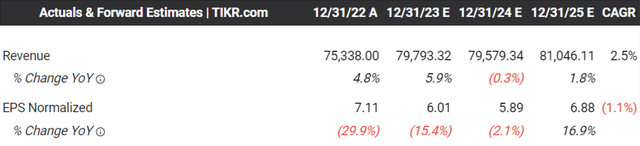
The same pessimism has been reflected in the consensus forward estimates’ minimal top and bottom line projections at a CAGR of +2.5% and -1.1% through FY2025, compared to its historical trend of +1.3% and +7.1% between FY2016 and FY2022, respectively.
This is compared to JPM’s forward CAGRs of +7.5%/ +7.6%, BAC’s +2.7%/ +2.4%, WFC’s +3.4%/ +5.7%, respectively, naturally corresponding with their richer FWD P/E valuations.
For now, while C historically does not offer forward guidance, we may see the bank generate a FY2023 adj EPS performance of $6.27 (-11.8% YoY), assuming a similar performance in FQ4’23 at $1.52 (inline QoQ/ -6.7% YoY).
This builds upon FQ3’23 performance at $1.52 (+10.9% QoQ/ -6.7% YoY), FQ2’23 at $1.37 (-26.3% QoQ/ -40.4% YoY), and FQ1’23 at $1.86 (+60.3% QoQ/ -7.9% YoY).
Based on this assumption, it appears that the C stock is also trading near its fair value of $42.19, based on our FY2023 adj EPS projection of $6.27 and the stock’s FWD P/E valuation of 6.73x.
Then again, due to its minimal growth prospects with a consensus FY2025 adj EPS estimates of $6.88, there appears to be a reduced upside potential of +15.5% to our long-term price target of $46.30.
So, Is C Stock A Buy, Sell, or Hold?
C 10Y Stock Price
Trading View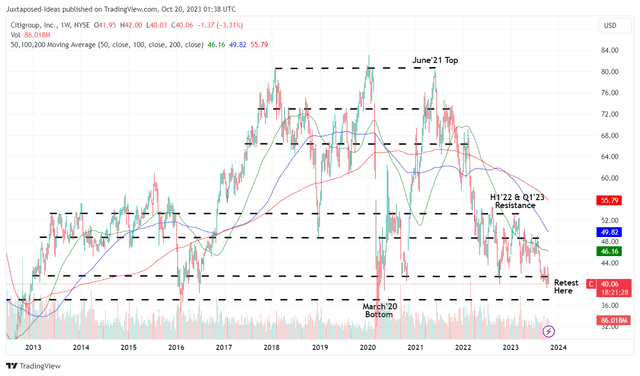
For now, C has dramatically lost much of its gains over the past ten years, with the stock also likely to retest its critical support levels of $40 in the near term.
Depending on how market sentiments develop moving forward, we may see the stock further retrace to its next support level of $37, implying a downside potential of -7.5% from current levels.
As a result, while the C stock may offer a tempting forward dividend yield of 5.24%, compared to its 5Y mean of 3.60% and sector median of 4.07%, investors may want to temper their recovery expectations for a little longer, especially since it remains to be seen when its reversal may occur.
In addition, the stock’s dividend investment thesis appears to be mixed moving forward, based on its underwhelming FWD Dividend Per Share Growth of +1.80%, compared to its 5Y mean of +12.91% and sector median of +5.50%.
Then again, C has also executed excellent shareholder returns thus far, with $5.12B of dividends paid out and $3.56B in share repurchases over the last twelve months, with 215M of shares already retired since FY2019.
Combined with its apparent undervaluation to its book value per share of $99.28 (+1.4% QoQ/ +7% YoY), we are cautiously rating the C stock as a Buy here, with the promise of a great upside potential if the management is able to realize its RoTCE target over the next few years.
Despite so, investors may want to size their portfolios accordingly, with the stock already losing -16.38% of its value since our June 2023 Buy rating, compared to the SPY’s -2.68% at the same time.
While its dividend remains safe based on the Seeking Alpha Quant rating of B-, there is a good chance that C may also be a value/ dividend trap moving forward, with its dividend income story likely negated by the sustained stock decline of -49.7% since the June 2021 peak.
As a result of its mixed prospects, interested investors may want to monitor the situation for a little longer before adding according to their dollar cost averages and risk appetite.