
Wasan Tita
New listings rose in August, when they normally fall in August, an interesting break in the seasonal pattern.
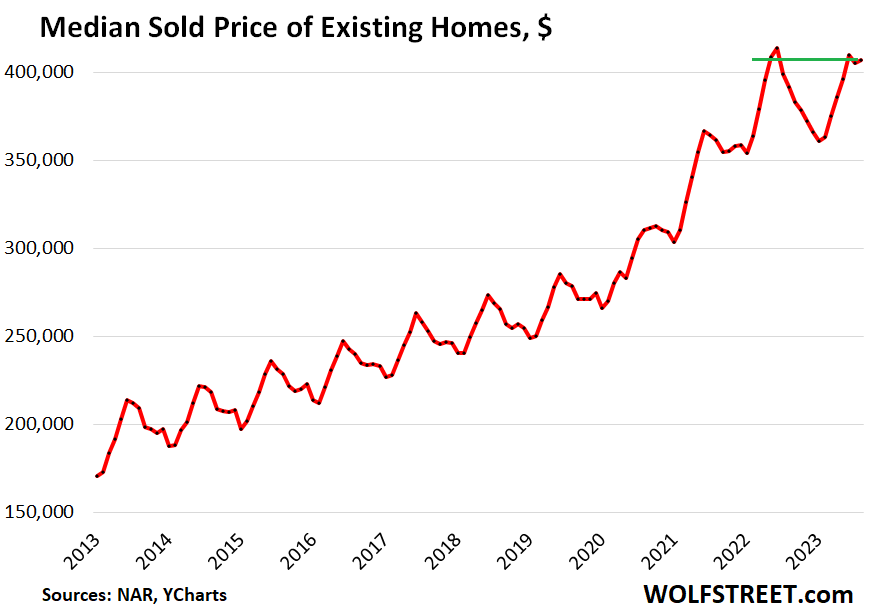
Let’s start with the median price, which in August was $407,100, roughly flat with a month ago, but that month-ago figure was revised down today by $1,000, and after that downward revision, today’s price ticked up by a hair.
Due to the plunge in July and August 2022, the median price was up 3.9% year-over-year. From the peak in June 2022, the median price was down 1.6% (historic data via YCharts):
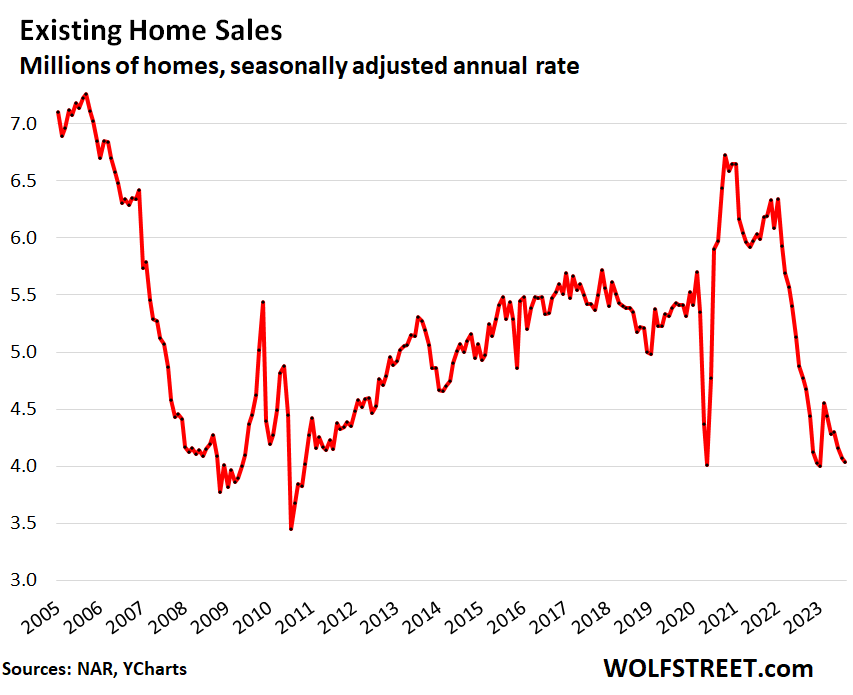
Sales of previously-owned houses, condos, and co-ops continued to fall on a seasonally adjusted basis to an annual rate of 4.04 million homes in August, roughly level with the deep-dismal rate of March 2020, which had been the lowest since the Housing Bust in 2010, according to data from the National Association of Realtors today.
But new listings rose, which they never do in August, and median days on the market rose, active listings rose, and price reductions as a percent of active listings jumped to the second-highest level for any pre-pandemic month in the data, behind only July 2018, according to realtor.com.
The seasonally adjusted annual rate of sales of 4.04 million homes was down 15.3% from the already depressed levels a year ago. Compared to the Augusts in prior years (historic data via YCharts):
- August 2021: -32.6%.
- August 2019: -25.6%.
- August 2018: -24.5%.
Demand and supply have vanished in equal measure because the homeowners with a 3% mortgage are not buying a new home, so they have vanished as buyers; and they’re therefore not listing their current home, and so they have also vanished as sellers. This phenomenon caused the entire housing market – buyers and sellers – to shrink by about 20%, I estimated here.
Because these homeowners vanished as both buyers and sellers at the same time, there is less churn, and realtors make money off the churn coming and going, and so they loudly lament this situation that is so dire for them.
But as far as the market is concerned, with both buyers and sellers gone in equal measure, the balance is still there, but it’s just a lot lower: lower demand, lower supply, and lower churn.
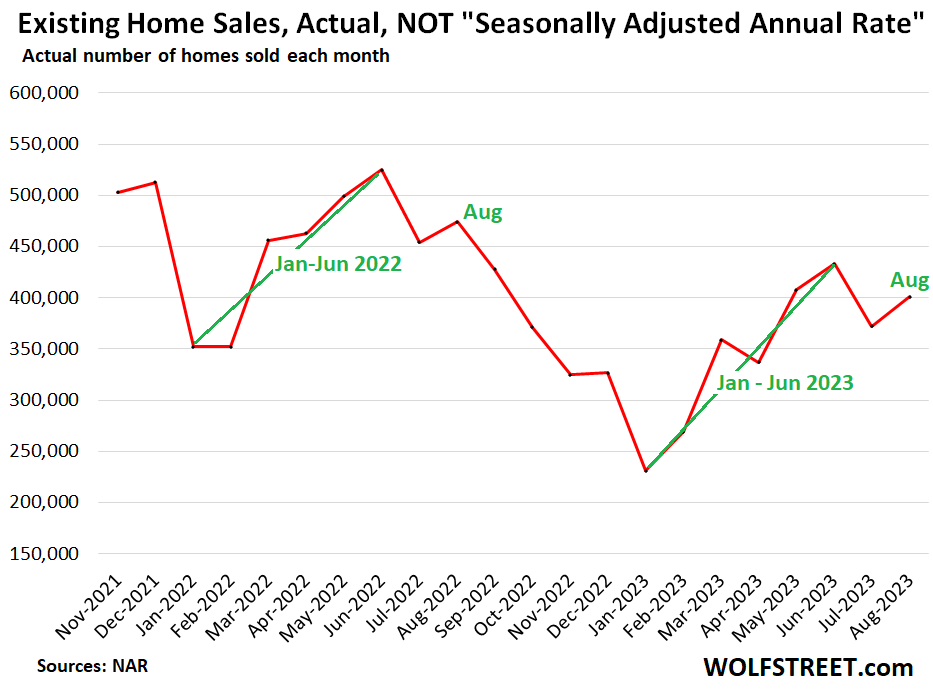
Actual sales in August – not seasonally adjusted annual rate – at 401,000 homes, was up from July due to seasonality. Year-over-year, actual sales fell 15.4%.
Note the seasonal patterns: the “spring selling season” (green) that culminated in June, followed by the drop in July, the rise in August, to be followed by declines the rest of the year. The actual sales data provide a better understanding of sales and seasonality than the seasonally adjusted annual rate of sales above (data via NAR):
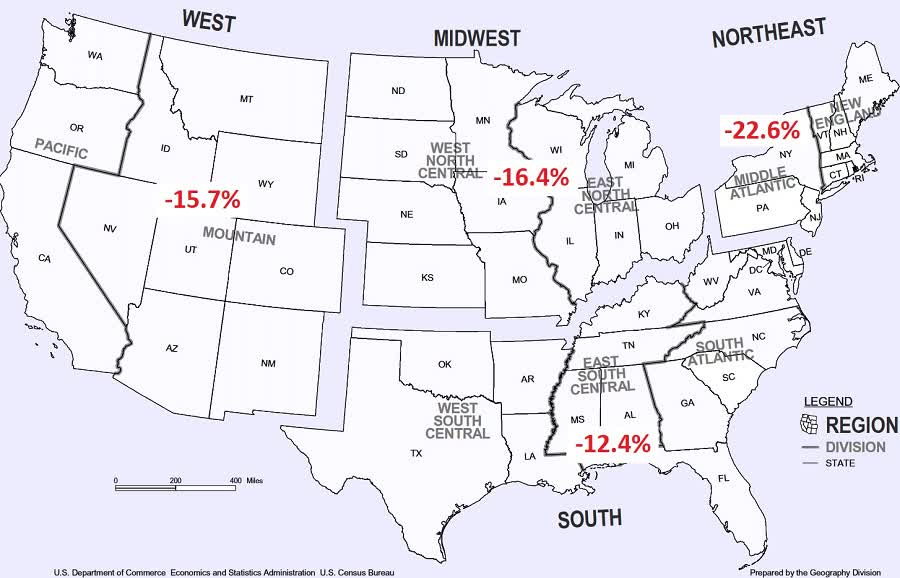
By region, year-over-year sales plunged in all regions from the already beaten-down levels last year:
Cash buyers and Investors pulled back too: All-cash sales – often investors and second home buyers – dropped by 5% year-over-year to 108,000 homes in August, or a share of 26% of total sales.
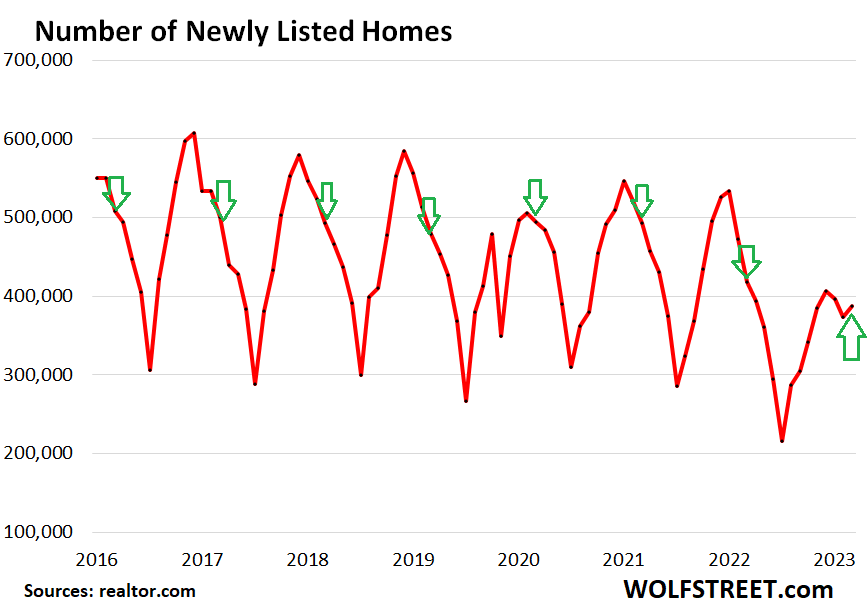
New listings rose in August, which they never do in August. New listings seasonally fall in August. June is generally the peak of new listings in every year. July is the beginning of their decline through the rest of the year. But this August, for the first time in the data, new listings rose. And that is an interesting break from the normal seasonal pattern (data via Realtor.com):
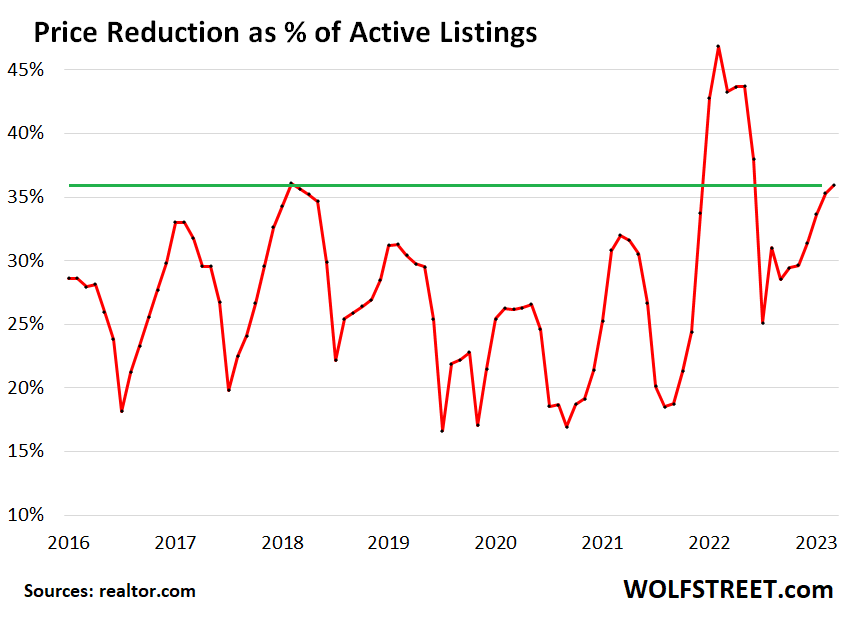
Price reductions as a percent of active listings jumped to 35.9%, which about matched the pre-pandemic high in July 2018, as sellers are getting more motivated to sell their homes. Lower the price, and they will come (data via realtor.com:
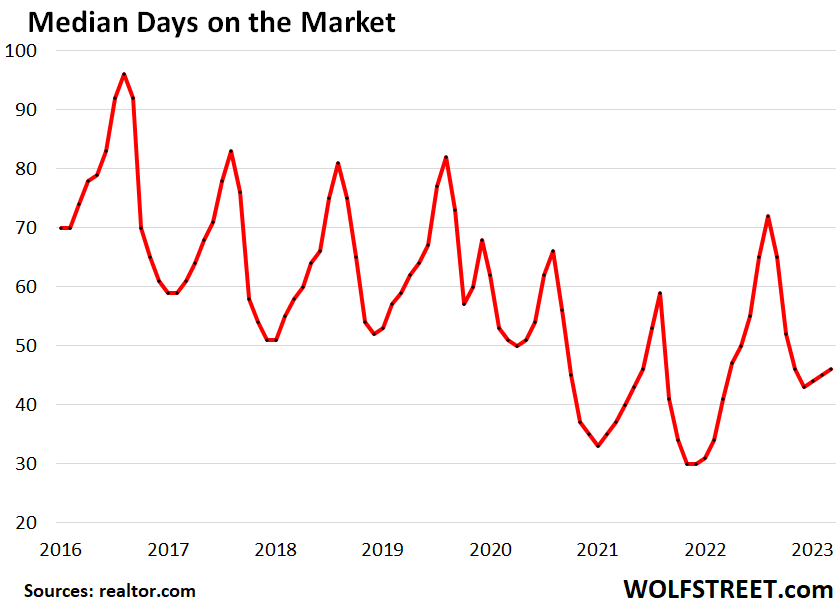
Days on the market lengthened: Homes spent 46 days on the market in August before they were either sold or pulled off the market, up from 41 days in August 2022, according to data from Realtor.com.
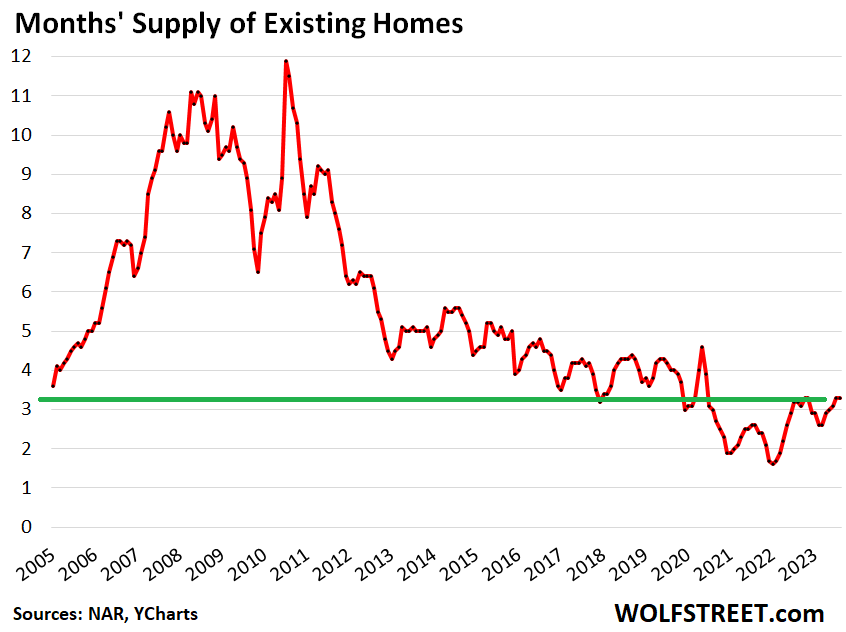
Supply remained at 3.3 months, matching the highs in 2022 (October and November) and beyond that, the most supply since June 2020, according to NAR. Supply in 2017 through 2019 ranged between 3.0 and 4.3 months (historic data via YCharts).
Inventory for sale dipped to 1.1 million homes in August, from 1.11 million in July. But wait…
Inventories have been declining ever since 2007. The reason is how technological innovation in RE has hit “inventory” the way inventory is defined: A home enters inventory when it is initially listed for sale in the MLS, and it exits inventory when the sale closes or when the home is pulled off the market.
The time it takes to do all the processes from marketing the home to getting a mortgage approved, shuffling documents around, and closing the sale determine how long a home sits in “inventory.”
Technology has dramatically shrunk the time it takes to do all this, and so homes spent less time in inventory waiting for these processes to happen, and because each home spent less time in inventory, overall inventory drops.
So inventory shrank year after year for 15 years because the processes sped up. This is a crucial concept.
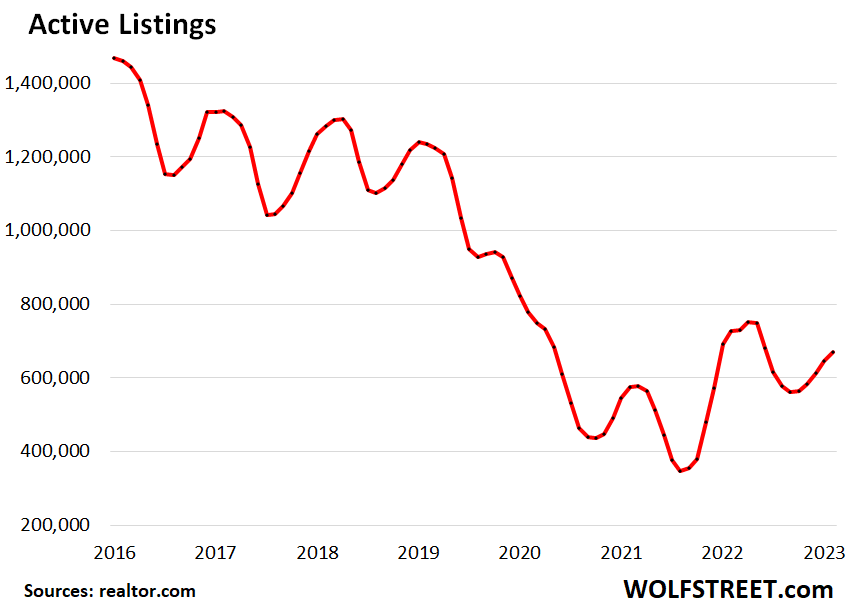
Active listings rose in August from July to 669,173 homes and were down 7.8% year-over-year. The same technological changes, but to a lesser extent, also speed up processes and thereby reduce the amount of time a home spends in the active listings (data via realtor.com):
Editor’s Note: The summary bullets for this article were chosen by Seeking Alpha editors.