
Historical downward trend from September
Over the nine-year period from 2014 to 2022, Bitcoin’s September performance was largely bearish. The closing price in September was often lower than the opening price, indicating an overall downward trend for the month.
Bitcoin price analysis year by year
2014: Opened at $479 and closed at $391, down 18.37%.
2015: Opened at $230 and closed at $236, up slightly 2.6%. This year is an exception to the general downward trend.
2016: Opened at $570 and closed at $608, up 6.67%. Another exception to the downward trend.
2017: Opened at $4,734 and closed at $4,326, down 8.62%. This year there was a significant intra-month decline of almost 40%.
2018: Opened at $7,015 and closed at $6,597, down 5.96%.
2019: Opened at $9,593 and closed at $8,298, down 13.49%.
2020: Opened at $11,658 and closed at $10,778, down 7.55%.
2021: Opened at $47,118 and closed at $43,834, down 6.97%.
2022: Opened at $20,049 and closed at $19,429, down 3.09%.
Average decrease in September
Excluding the two years (2015 and 2016) in which Bitcoin saw an increase in September, the average decline for the remaining years is approximately 9.03%.
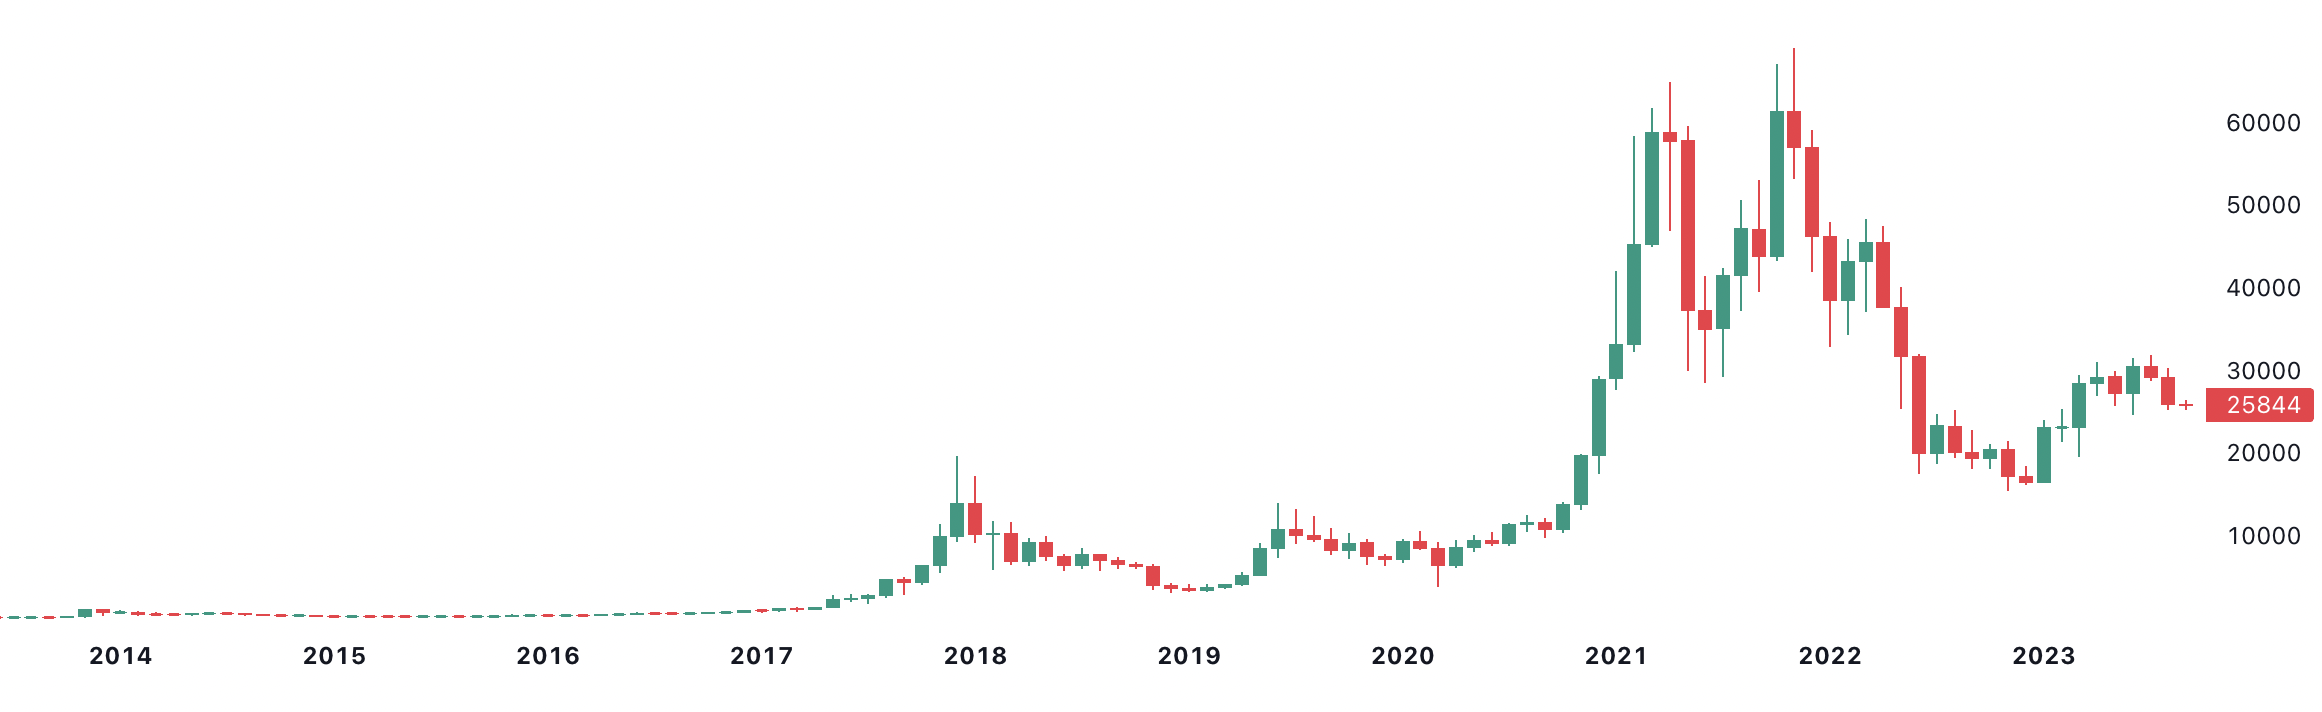
Source: TradingView
Annual amplitude analysis:
For Bitcoin, the month of September is historically characterized by significant price fluctuations. A detailed examination of the past nine years reveals the magnitude of these price movements, providing a clearer picture of the cryptocurrencies September behavior. The formula is used below: (High – Low) / Low.
2014: Bitcoin saw an amplitude of 36.16%, fluctuating between a low of $365 and a high of $497.
2015: The amplitude was more moderate this year, recorded at 10.31%, with the price fluctuating between $223 and $246.
2016: Bitcoin’s amplitude was 10.95%, while its price fluctuated between $566 and $628.
2017: This year saw a dramatic amplitude of 67.43%, with Bitcoin’s price ranging from $2,973 to a high of $4,979.
2018: The amplitude was 21.62% as Bitcoin’s price ranged between $6,094 and $7,411.
2019: Bitcoin saw a significant amplitude of 41.97%, with the price fluctuating between $7,714 and $10,949.
2020: The amplitude for this year was 22.60%, while Bitcoin price moved within the range of $9,825 and $12,065.
2021: Bitcoin’s amplitude was recorded at 33.81%, with prices fluctuating between $39,573 and $52,956.
2022: The amplitude was 25.47%, while Bitcoin’s price ranged between $18,157 and $22,781.’
The formula is used below: (High – Low) / ((High + Low)/2).
2014: The amplitude was 28.91%, with Bitcoin prices ranging between a low of $365 and a high of $497.
2015: Bitcoin’s amplitude was 10.14% and fluctuated between $223 and $246.
2016: The amplitude for the year was 10.77% as Bitcoin prices went from a low of $566 to a high of $628.
2017: Bitcoin saw an amplitude of 50.15%, with prices fluctuating between $2,973 and $4,979.
2018: The amplitude for the year was 20.18% as Bitcoin prices ranged between $6,094 and $7,411.
2019: Bitcoin saw an amplitude of 33.33%, with prices ranging from $7,714 to $10,949.
2020: The amplitude for the year was 20.41%, while Bitcoin prices fluctuated between $9,825 and $12,065.
2021: Bitcoin’s amplitude was 28.28%, with prices fluctuating between $39,573 and $52,956.
2022: The amplitude for the year was 22.22% as Bitcoin prices ranged between $18,157 and $22,781.
Average September Amplitude
The average amplitude for Bitcoin in September over the years 2014 to 2022 according to the traditional formula is approximately 29.92%. Using the alternative formula, the average amplitude is approximately 24.91%
Current Bitcoin Data
Bitcoin started September 2023 with an opening price of $25,927. Despite reaching a monthly high of $26,429, the cryptocurrency took a dip and recorded a low of $25,333. At the time of writing, Bitcoin is trading at $25,850.
As September progresses, Bitcoin market analysts have predicted potential lows for Bitcoin by the end of September.
Predicting the future based on historical trends
Historical Declines: Looking at past performance, Bitcoin’s most pronounced decline in September was -3.09% in 2022. If 2023 reflects this trend, Bitcoin could settle around $25,107 by the end of the month.
The average decline over the years fluctuates around -9.22%. If this average is indicative of this year’s performance, Bitcoin could end September around $23,530.
Amplitude Analysis: Using the alternative amplitude formula, it was determined that Bitcoin’s amplitude for September 2018 was approximately 19.51%. The most limited amplitude in September was recorded in 2015 with 10.31%. If this month’s price movements are in line with this moderate amplitude, mainly in the downward trajectory, Bitcoin’s valuation could fall to $23,240 by the end of September.
If we take into account the average amplitude over the years, which is around 27.21%, Bitcoin could fall to $18,860 by the end of the month in the worst case.
However, Bitcoin’s price has the potential to defy historical trends and close September above $25,927, similar to the positive performance seen in 2015 and 2016.
While these projections provide a look at historical trends, the inherently volatile nature of cryptocurrencies suggests that actual outcomes may vary. Investors and traders are advised to exercise caution and stay abreast of market developments.
Disclaimer and Copyright Notice: The content of this article is for informational purposes only and is not intended as financial advice. Always consult a professional before making any financial decisions. This material is the exclusive property of Blockchain.News. Unauthorized use, duplication or distribution without express permission is prohibited. Any permitted uses require appropriate credit and direction to the original content.
Image source: Shutterstock