 Price Breakout Causes Significant Increase")
The Aptos (APT) price breakout from a long-term descending resistance trendline on October 21 led to a high of $6.41.
Shortly after the breakout, Aptos reclaimed the $5.65 horizontal area. Where will it go next?
Aptos Breaks Out From 270-Day Resistance
The APT price had fallen under a descending resistance line since reaching an all-time high price of $20.40 on January 24. The decrease led to a low of $4.70 on October 11. This was a decrease of 77% in 258 days.
The APT price has increased since, breaking out from the descending resistance trendline on October 21. At the time of the breakout, the trendline had been in place for nearly 270 days.
Read More: 9 Best AI Crypto Trading Bots to Maximize Your Profits
Shortly afterward, the altcoin reclaimed the $5.65 horizontal resistance area.
The daily Relative Strength Index (RSI) is bullish. The RSI is a momentum indicator traders use to evaluate whether a market is overbought or oversold and determine whether to accumulate or sell an asset.
Readings above 50 and an upward trend suggest that bulls still have an advantage. While readings below 50 indicate the opposite.
The RSI is above 50 and increasing, both signs of a bullish trend. While the indicator is overbought, there is no bearish divergence to warn of an impending decrease.
Read More: 9 Best Crypto Demo Accounts For Trading
APT Price Prediction: How Long Will Increase Continue?
Technical analysts employ the Elliott Wave theory to identify recurring long-term price patterns and investor psychology. This helps traders determine the direction of a trend.
The most likely wave count is bullish and validated the APT price breakout. It suggests the APT price is in wave four of a five-wave upward movement (white). Wave three extended and has 2.61 times the length of wave one.
Since wave four is corrective, APT is expected to decrease towards the 0.382-0.5 Fib retracement support area at $5.65 and $5.80.
According to the Fibonacci retracement levels theory, following a significant price change in one direction, the price is expected to partially return to a previous price level before continuing in the same direction.
After the correction is complete, APT could increase to the next closest resistance at $7.60, completing wave five in the process. This would be an upward movement of 26%.
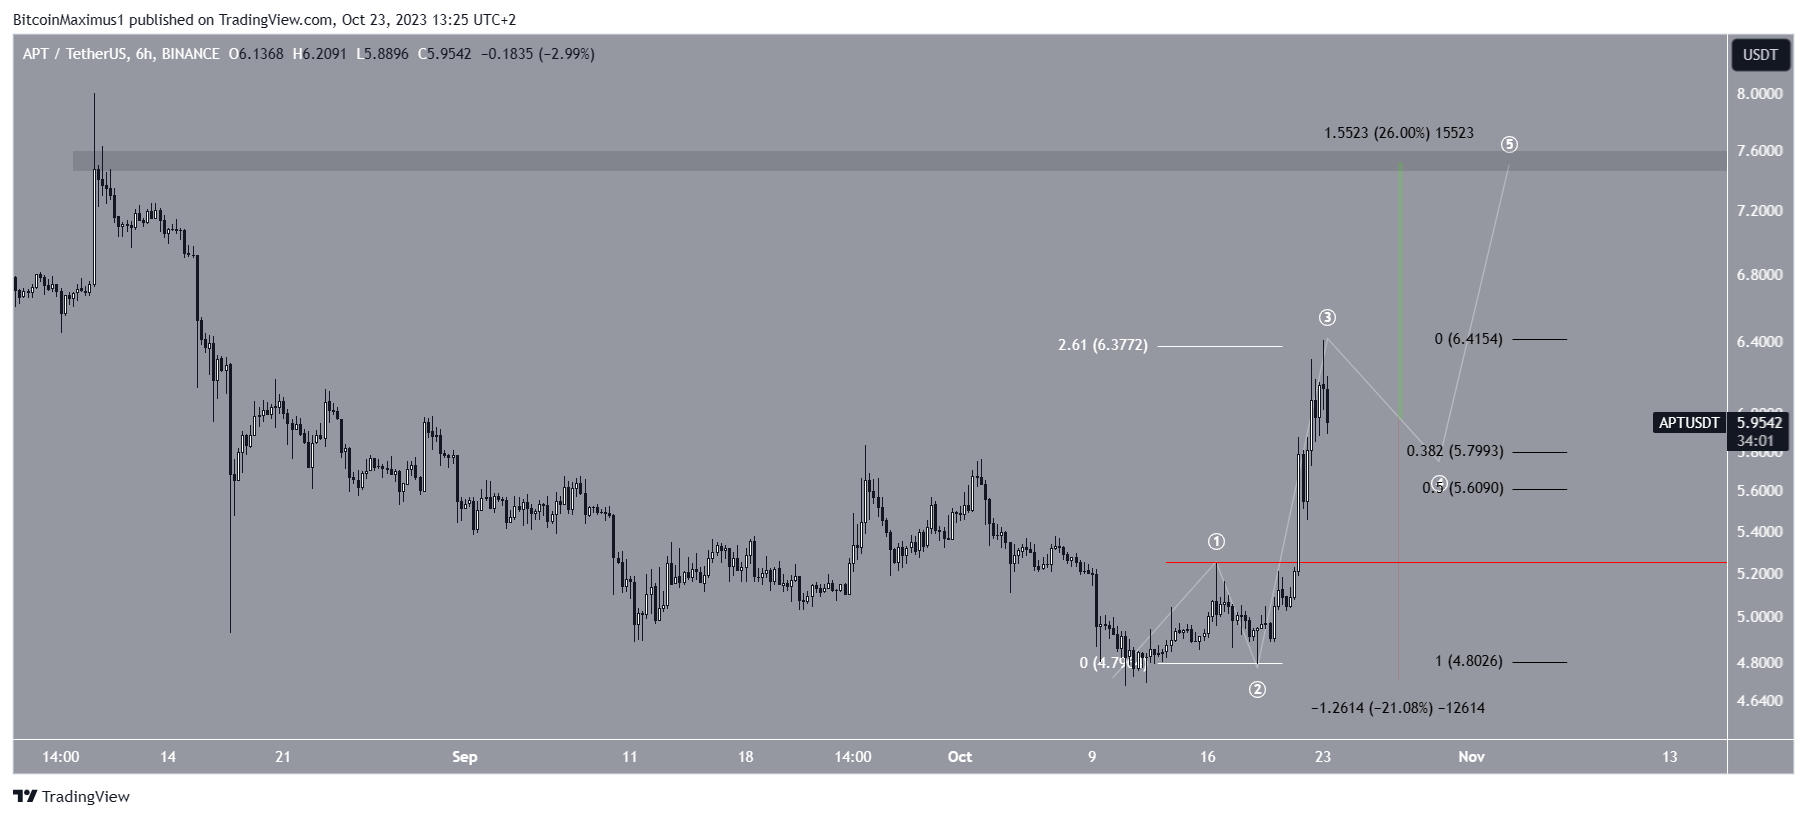
Despite this bullish APT price prediction, a decrease below the wave one high (red line) of $5.22 would invalidate the count since it would break EW theory guidelines.
In that case, a 21% drop to the $4.70 support area will be likely.
For BeInCrypto‘s latest crypto market analysis, click here.
Disclaimer
In line with the Trust Project guidelines, this price analysis article is for informational purposes only and should not be considered financial or investment advice. BeInCrypto is committed to accurate, unbiased reporting, but market conditions are subject to change without notice. Always conduct your own research and consult with a professional before making any financial decisions.