
In short
- The total cryptocurrency market cap is $3.08 trillion, down 1% from Sunday, but back above $3 trillion after last week’s panic.
- The Fear and Greed Index has recovered from Extreme Fear levels of 10 at the end of November to 24 (Fear).
- Both BTC and ETH trade under death-cross conditions: if history repeats itself, a crypto winter could be in the offing.
Monday’s trading session turns the crypto market a bit green, but before you start planning your Lambo order, be sure to consult the charts: they urge a more cautious approach.
The total crypto market cap stands at $3.08 trillion, according to CoinMarketCap, down about 1% from yesterday, but at least still within the $3 trillion area that the bulls had desperately defended. Also, the Crypto Fear and Greed Index has clawed its way to 24 – still firmly in ‘Fear’ territory – but that’s a recovery from the ‘Extreme Fear’ values of 10 we saw in late November when Bitcoin flirted with $80,000.
The broader picture? We are in a post-all-time-high bearish correction that could turn into something longer lasting.
Both Bitcoin and Ethereum have confirmed death crosses – that ominous technical pattern where the 50-day moving average falls below the 200-day mark. If history is any guide, and it often is, next year could take the form of a crypto winter. On the other hand, earlier death crosses in this cycle have marked local bottoms rather than cliff edges. The jury is still out.
On the macro front, traders are betting on a nearly 90% probability of a Federal Reserve rate cut next Wednesday, according to data from FedWatch. Lower interest rates tend to make risky assets like crypto more attractive compared to bonds, but whether that is enough to undo the technical damage remains to be seen.
Bitcoin: The $90,000 Battlefield
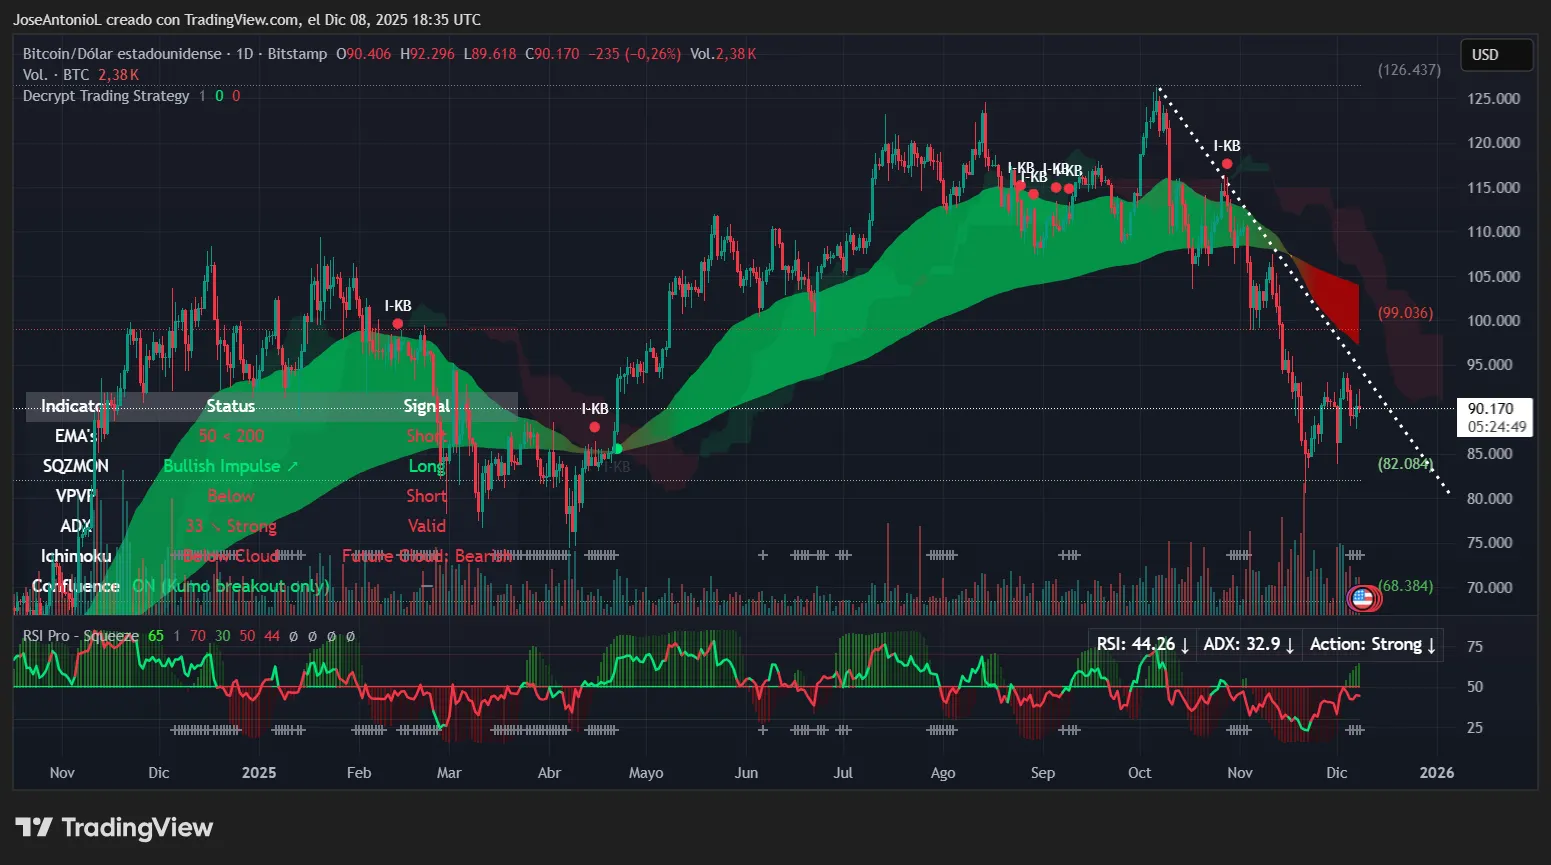
Bitcoin recently traded at $90,170, down a modest 0.26% on the day but up 6.4% over the past seven days. The flagship cryptocurrency reached an intraday high of $92,296 and found support at $89,618. Nothing dramatic, but it still shows how bears can lend a hand even with a small recovery.
Bitcoin’s EMAs are in a bearish line: the 50-day mark is trading below the 200-day level, confirming the death cross that formed on November 16 with prices well above the EMA50 resistance. The Ichimoku clouds – another complex indicator that aims to predict future prices based on past movements – indicate a bearish situation for the near future, so things don’t look great even if prices rise.
The Average Directional Index (ADX) stands at 32.9, which is arguably a strong trend area. Anything above 25 confirms that there is a trend, and above 30 means it is emerging. Right now, that trend is currently pointing downward. The ADX doesn’t tell you direction, just power. Combined with the bearish EMA setup, this suggests there is conviction behind the downtrend.
The Relative Strength Index (RSI) stands at 44.26, firmly in neutral territory – not oversold enough to attract bargain hunters, but not overbought enough to trigger profit-taking. It’s that mushy middle ground where neither bulls nor bears have a clear advantage.
The Squeeze Momentum Indicator shows a bullish impulse in a compression zone, which means that there will be a tug-of-war between bulls and bears in this zone, probably in an attempt to break the resistance that has been forming for weeks and which is visible on the charts as the dotted white line.
Key levels to watch:
- Resistance: $99,036 (immediate), $105,000 (strong/200 EMA)
- Support: $82,084 (immediate), $68,384 (strong)
Ethereum: The $3,000 Question
Ethereum is having a slightly better day than its bigger brother, which recently traded at $3,112, up 1.7% in the past 24 hours. The second largest cryptocurrency by market cap opened at $3,060.6, reached a high of $3,180 and found its bottom at $3,041, restoring the psychological level of $3,000 for a while.
This is a nice increase of 14% on the weekly candlestick charts.
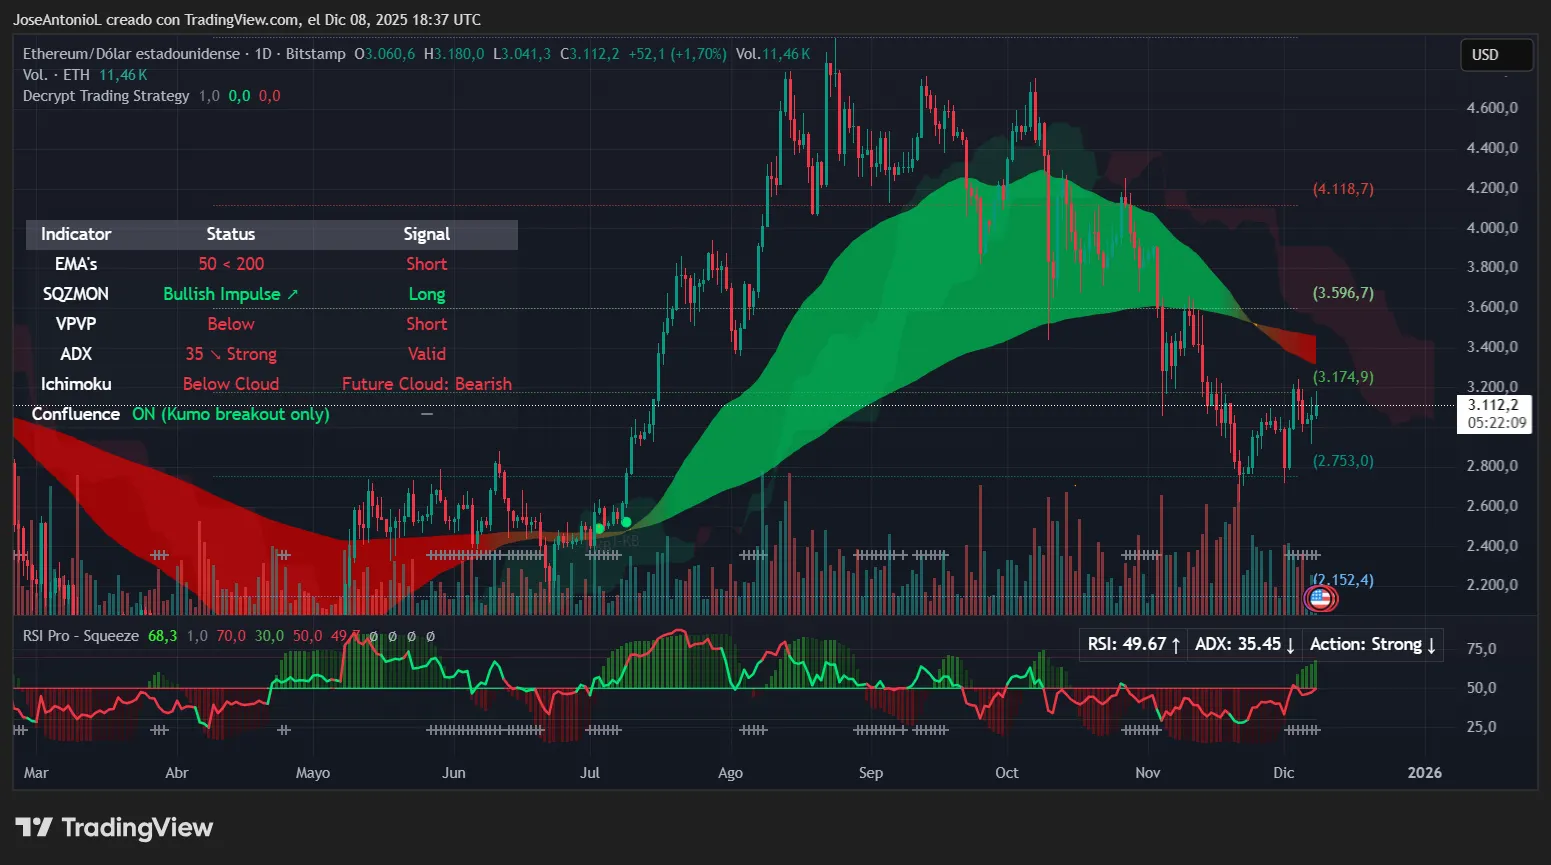
Like Bitcoin, Ethereum is trading under death cross conditions: the 50-day EMA is below the 200-day mark, indicating that short-term momentum has been weaker than long-term trends. The ADX at 35.45 confirms that, all things considered, there is a strong bearish trend.
The RSI at 49.67 is essentially neutral and ticking slightly higher, which at least indicates that selling pressure is easing. The Squeeze Momentum Indicator shows bullish momentum, suggesting that the compression in the market could be moving upwards. That said, ETH is trading under cloud with a bearish future cloud projection. When multiple indicators conflict in this way, it usually means the market has not yet made up its mind.
What should traders pay attention to? The $3,174 level (0.5 Fibonacci) serves as immediate resistance – ETH is actually testing this zone at the moment. Above that, $3,596 represents the 0.382 retracement and a more important hurdle as this is also the level at which the death cross formed.
Key Levels:
- Resistance: $3,174 (immediate), $3,596 (strong)
- Support: $2,753 (Immediate), $2,152 (Strong)
Wednesday’s Fed decision could create some volatility, and if the rate cuts materialize as expected, we could see a relief rally. But until BTC claims the 200-day EMA is around $105,000 and ETH breaks its cloud resistance, this will remain a bear market upswing until proven otherwise.
Disclaimer
The author’s views and opinions are for informational purposes only and do not constitute financial, investment or other advice.
Daily debriefing Newsletter
Start every day with today’s top news stories, plus original articles, a podcast, videos and more.
