
Submitted by SpotGamma
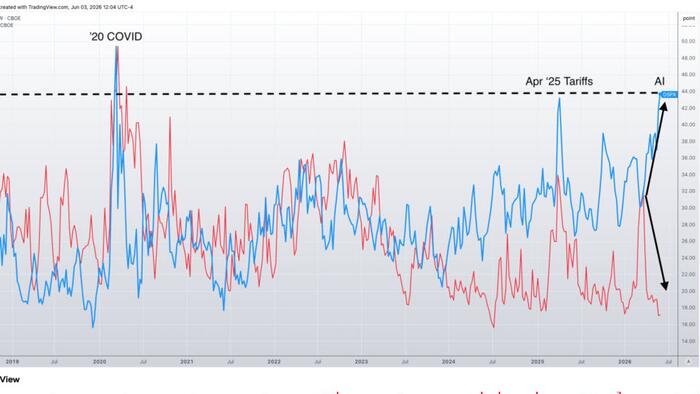
CBOE’s Dispersion Index (DSPX) is at levels only seen during Covid and the April ’25 tariff crash, while Correlation (COR1M) is near all-time lows. This divergence signals extreme positioning risk driven by the AI stock chase, and makes SPY downside hedges historically cheap.
Traders have been chasing AI related names in such heavy-handed fashion that it has now created positioning risk for the stock market.
Encapsulating this view are two popular CBOE options indexes: Dispersion (DSPX) and Correlation (COR1M).
What Are Dispersion DSPX & Correlation COR1M?
DSPX compares the options prices (IV) of the top US stocks vs SPX IV, and measures how different they are from each other. High dispersion means traders are assigning vastly different options prices to individual names. Today, we have traders frothing to chase upside in MU, SNDK, and the like, while scorning other sectors.
COR1M measures the direction of options prices for top US stocks vs the SPX. During periods of calm we generally see traders bit up call options, and sell SPX options, which creates low correlation. Conversely, when there is a lot of fear in the stock market, correlation spikes as traders sell all stocks and buy SPX options – typically puts.
Currently DSPX (blue) is at highs only seen since the Covid crash after just passing highs from the April 2025 Tariff drama. Meanwhile, COR1M (red), is nearing it’s lowest reading ever.
This gives us a massive never-before-seen divergence (black arrows) between spiking options prices (high dispersion) and only certain stocks surging higher (low correlation).
The previous highs in DSPX came during massive risk-off periods! Why? Because in both 2020 and in 2025 traders were pricing in vastly different risk due to traumatic events: in Covid cruise lines were crashing massively, whereas healthcare stocks were bid. During April ’25 it was about parsing tariff winners and losers. These heavy “winners and losers” environment created a lot of dispersion in options prices.
Today the massive dispersion is driven by the chase in AI stocks, which is now at extremes.
Notice, too, how correlation (red) spiked during those previous events as traders sold stocks sharply lower. In other words: all stocks crashed in Covid/Tariffs (i.e. high correlation), just some stocks crashed harder (high dispersion).
However correlation is at lows not seen since July of 2024, with July ’24 being the all-time low. This comes as traders are very complacent about downside risk – despite the Iran war situation.
How Do Options Prices Differ Across Stocks?
An under the hood view of this dynamic is shown with SpotGamma’s Compass tool. If a stocks call options are much more expensive than their calls, the plot lands toward the right of this chart (X axis). As traders anticipate more stock movement (IV), the plot lands higher on this chart (Y axis).
Compare SMH (yellow arrow), which is at the top right of this chart. Traders are betting that this stock is essentially going to contine crashing higher.
The tech-heavy QQQ is also in a showing a heavily bullish positioning, which traders betting that upside hot streaks continue. The big single stock constituents have effectively “infected” the Nasdaq Index with uber-bullish views.
The SPY, however, has been shifting away from call leaning positions, to put positions. However, the overall IV remains low, showing traders have simply been backing off from call positions vs strongly betting on downside.

SPX QQQ SMH Skew
The extreme readings here suggest options positioning could drive a stock volatility event, as extreme call positioning unwinds.
This difference (or dispersion) in options prices here creates many different trade setups, with different risk-rewards for traders:
SPY put options may be relatively much cheaper that puts in SMH, or QQQ. We view these as low risk, with potentially high reward.
More dramatically, selling calls in SMH or QQQ could offer fantastic rewards, but also bring major risks if the hot upside continues.
Parsing what type of downside position that may be right for you involves mapping out:
- How likely are the odds of a market correction
- The potential risk vs reward of various downside trade structures
Knowing these two elements sets up how you might select and position for a potential downside move.
Join our upcoming event on June 9th: Trade Like the House, where we will be combing positional analysis with probabilities, to gain structural edge with your trading.