
Pepe mint shows potential signs of revival, after a tumultuous period marked by a decline in value of more than 80% and insider trading and fraud scandals linked to the founder. Technical indicators across different time frames indicate possible bullish momentum for the cryptocurrency.
Technical Analysis: Both RSI and MACD indicate bullish momentum
Daily Time Frame On the daily chart, both the Moving Average Convergence Divergence (MACD) and the Relative Strength Index (RSI) show bullish divergence. Such patterns usually indicate a possible reversal in price developments.
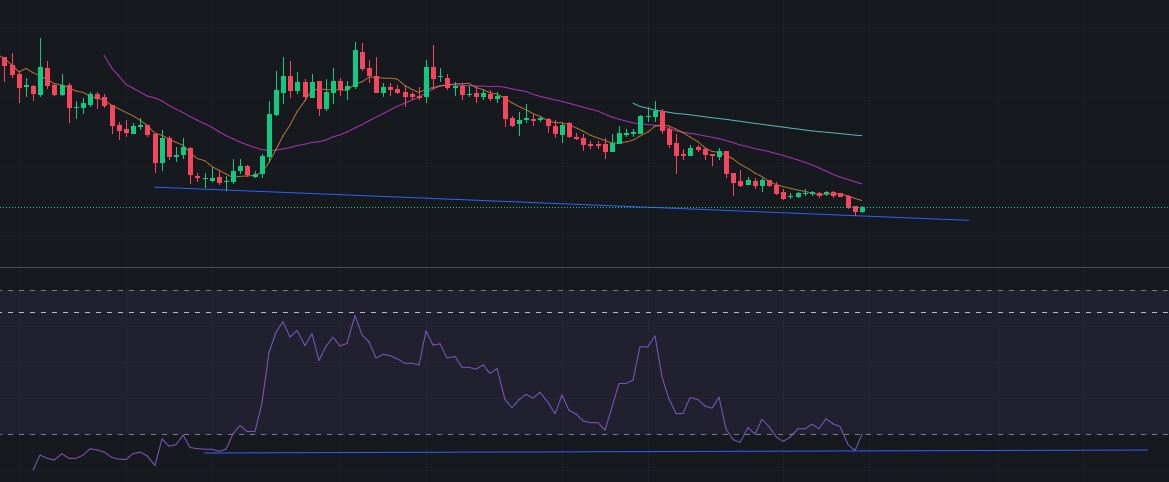
RSI divergence, source: Binance
A bullish RSI divergence occurs when an asset’s price makes a new low, but the Relative Strength Index (RSI) creates a higher low. This discrepancy signals a weakening of downward momentum and a possible upward price reversal. Traders often take this pattern as a sign that the current downtrend may be losing steam, and that a bullish trend could be on the horizon.
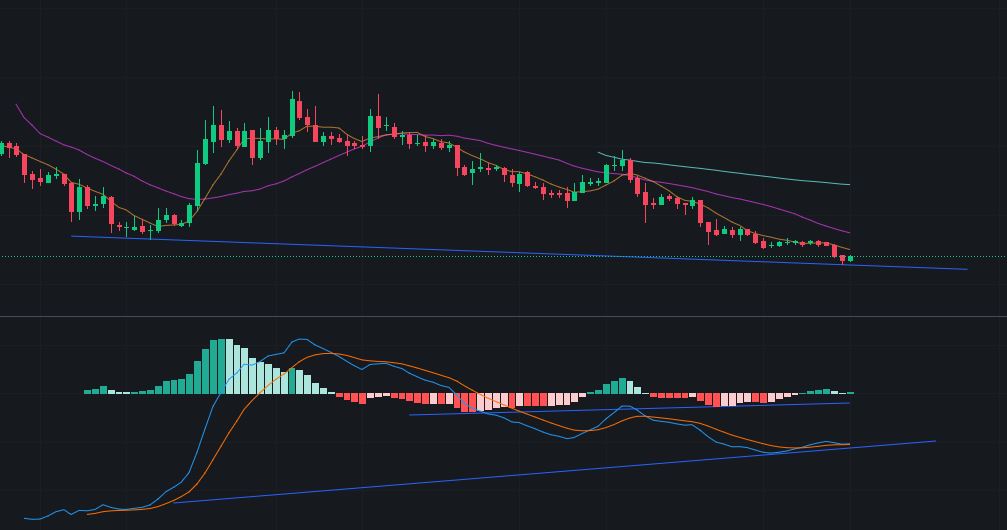
MACD Divergence, source: Binance
1-hour time frame: Similar bullish divergence patterns are also visible on the 1-hour chart, reinforcing the sentiment suggested by the daily indicators.
RSI Implications: The RSI, a momentum oscillator, is particularly noteworthy. When there is a bullish divergence in the daily time frame, it often means there is a strong appetite for a recovery, which may not be short-lived. This could mean that Pepe Coin will experience a more sustainable recovery in the coming days or weeks.
Pepe Coin remains within a descending channel
But keep in mind that the price trajectory of the Pepe coin is still characterized by a descending channel, indicating a consistent downward trend over a period of time. Investors and traders should approach this with some caution, as such patterns often indicate continued bearish momentum. To change this narrative and signal a potential bullish reversal, the price would need to reach a major milestone: breaking above the descending channel.
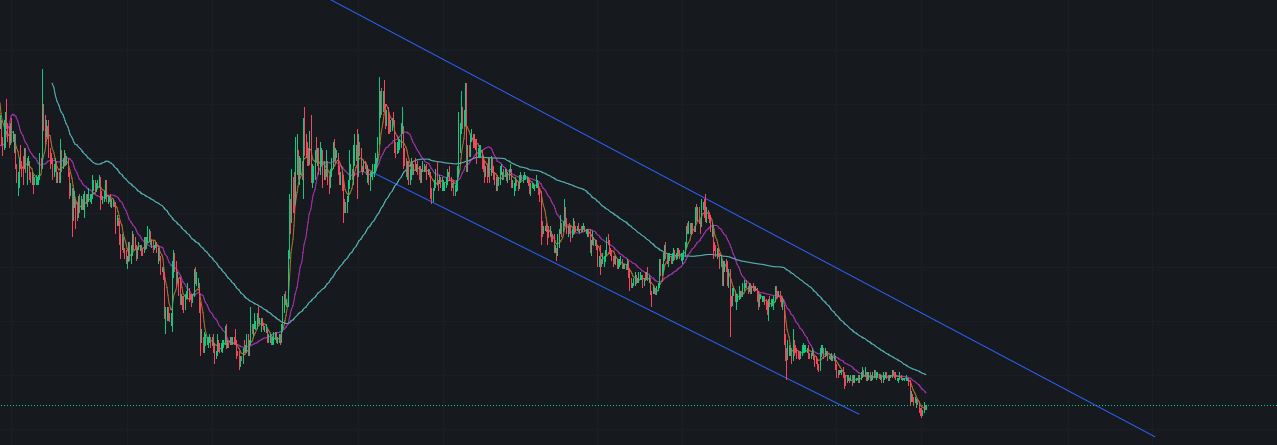
Descending channel, source: Binance
More importantly, after crossing this limit, it is crucial that the coin maintains its position and establishes itself firmly above the upper limit of the channel. This would be stronger confirmation of a trend reversal and provide a more optimistic outlook for the future performance of the cryptocurrency.
Although current market indicators point to an expected increase in the value of the Pepe coin, it is essential that investors exercise caution. As price moves closer to the upper limit of the descending channel, historical data and technical patterns indicate this is a potential resistance zone. In such scenarios, the upper limit often acts as a ceiling, making it difficult for the asset to break through. Given all this, it may be a strategic move for investors looking to maximize returns and minimize potential downsides to consider selling or reducing their investments once the price approaches this critical threshold.
A crucial caveat to consider is that if Bitcoin experiences a downturn, most other coins, including Pepe, will likely follow suit. Pepe’s potential rebound is also closely tied to Bitcoin’s future price trajectory. Furthermore, while the presence of bullish divergence is promising, there are cases where a double bullish divergence is necessary to amplify a rebound, especially for coins that have witnessed significant declines.
Disclaimer and Copyright Notice: The content of this article is for informational purposes only and is not intended as financial advice. Always consult a professional before making any financial decisions. This material is the exclusive property of Blockchain.News. Unauthorized use, duplication or distribution without express permission is prohibited. Any permitted uses require appropriate credit and direction to the original content.
Image source: Shutterstock