
Solana’s price has staged a sharp rebound after one of its steepest declines. After breaking down from its descending channel on February 4, SOL plunged nearly 30% to around $67. Since then, the token has recovered more than 15%, climbing back toward the $78 region.
At first glance, the bounce looks encouraging. However, on-chain data suggests that the rebound may be driven by short-term speculation rather than strong long-term demand. Historical patterns show that similar recoveries often fade quickly when speculative money comes in strongly. Current metrics indicate that Solana may still be vulnerable to another leg lower if one key level isn’t reclaimed.
Sponsored
Sponsored
Descending Channel Breakdown Triggered the 30% Drop
Solana’s sell-off accelerated after the price decisively broke the lower trendline of its descending channel on February 4, in line with an earlier SOL price analysis.
Once the lower trendline support failed, SOL quickly moved toward its projected downside target near $67, completing a decline of nearly 30% from recent highs.
Want more token insights like this? Sign up for Editor Harsh Notariya’s Daily Crypto Newsletter here.
After reaching the $67 zone, buyers stepped in and triggered a rebound toward $78. While this move represents a recovery of more than 15%, the broader technical structure has not improved.
Similar rebounds in past cycles have often occurred after major dips, but they rarely marked durable reversals unless supported by strong accumulation. So far, the current bounce lacks that confirmation as the buyer persona is now under the scanner.
Short-Term Buyers Lead the Rebound as Long-Term Holders Reduce Exposure
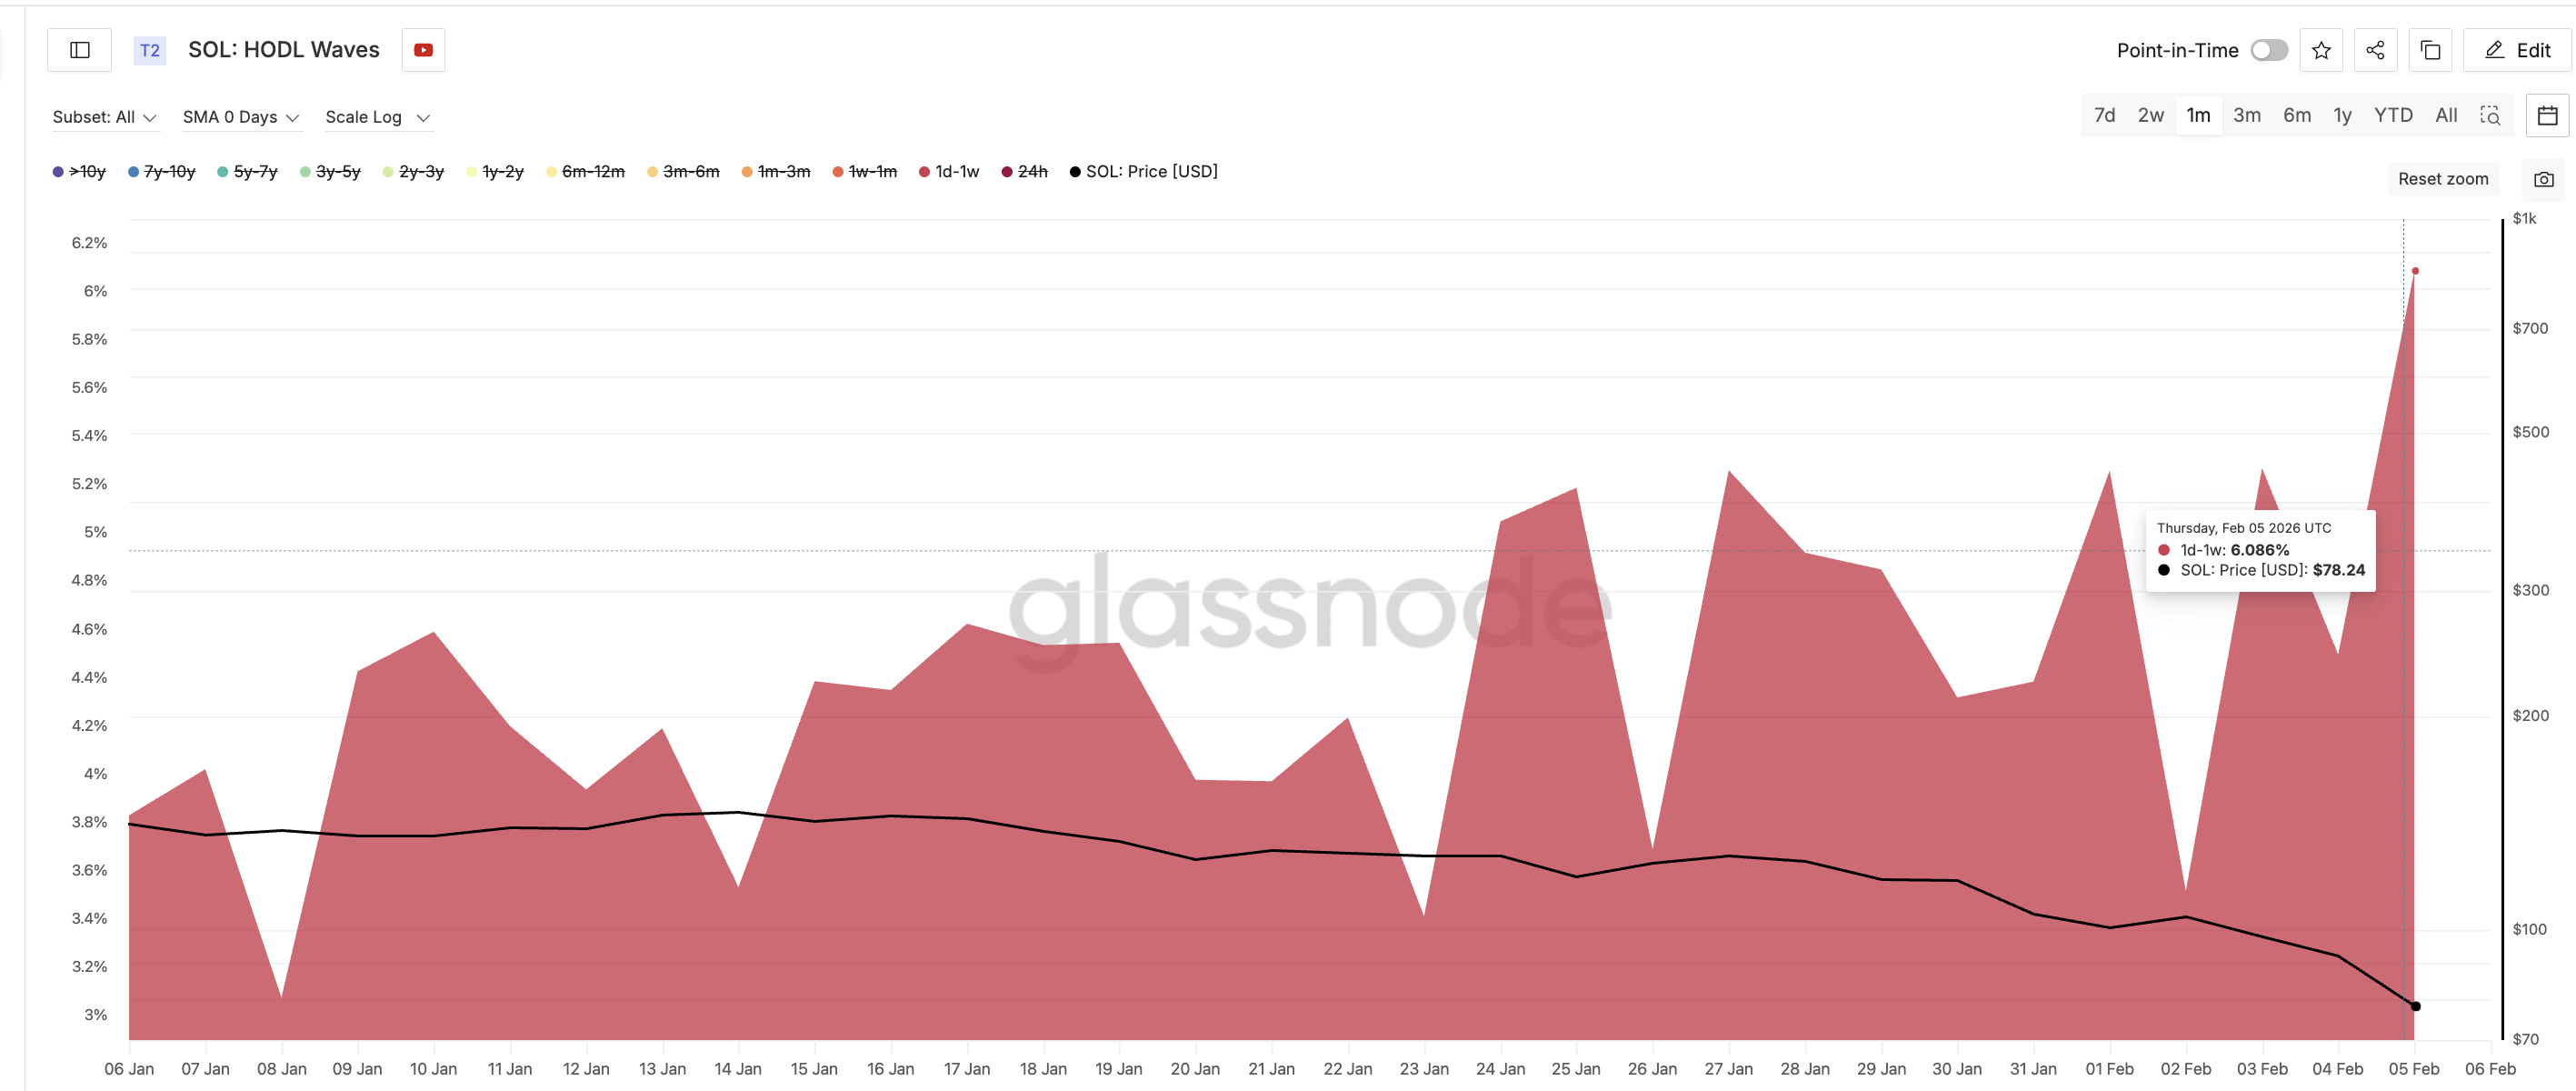
On-chain data shows that Solana’s rebound is being driven mainly by short-term holders rather than long-term investors. According to the HODL waves metric, which separates wallets by time held, the one-day to one-week cohort increased its share of supply from 4.49% to 6.08% between February 4 and February 6.
Sponsored
Sponsored
This represents a sharp rise in speculative participation over a short period. Historically, this group tends to sell quickly during periods of weakness, making their buying activity unreliable as a foundation for sustained rallies.
A similar pattern appeared in late January. On January 27, short-term holders controlled around 5.26% of the supply. By January 31, their share had dropped to 4.38% as they sold into weakness. During that period, Solana’s price fell from around $127 to $105, a roughly 17% decline.
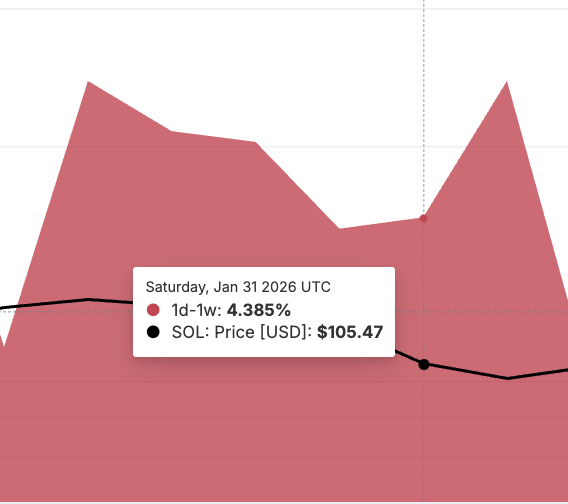
This behavior highlights how quickly short-term buyers can exit when momentum fades. With their current share rising again, the recent rebound risks unraveling if selling pressure returns.
Sponsored
Sponsored
At the same time, long-term holders continue to reduce exposure. The Hodler net position change metric, which tracks long-term investor holdings, has declined from approximately 2.87 million SOL on February 3 to around 2.37 million SOL by February 5. A 17% dip in two days, amid the dip.
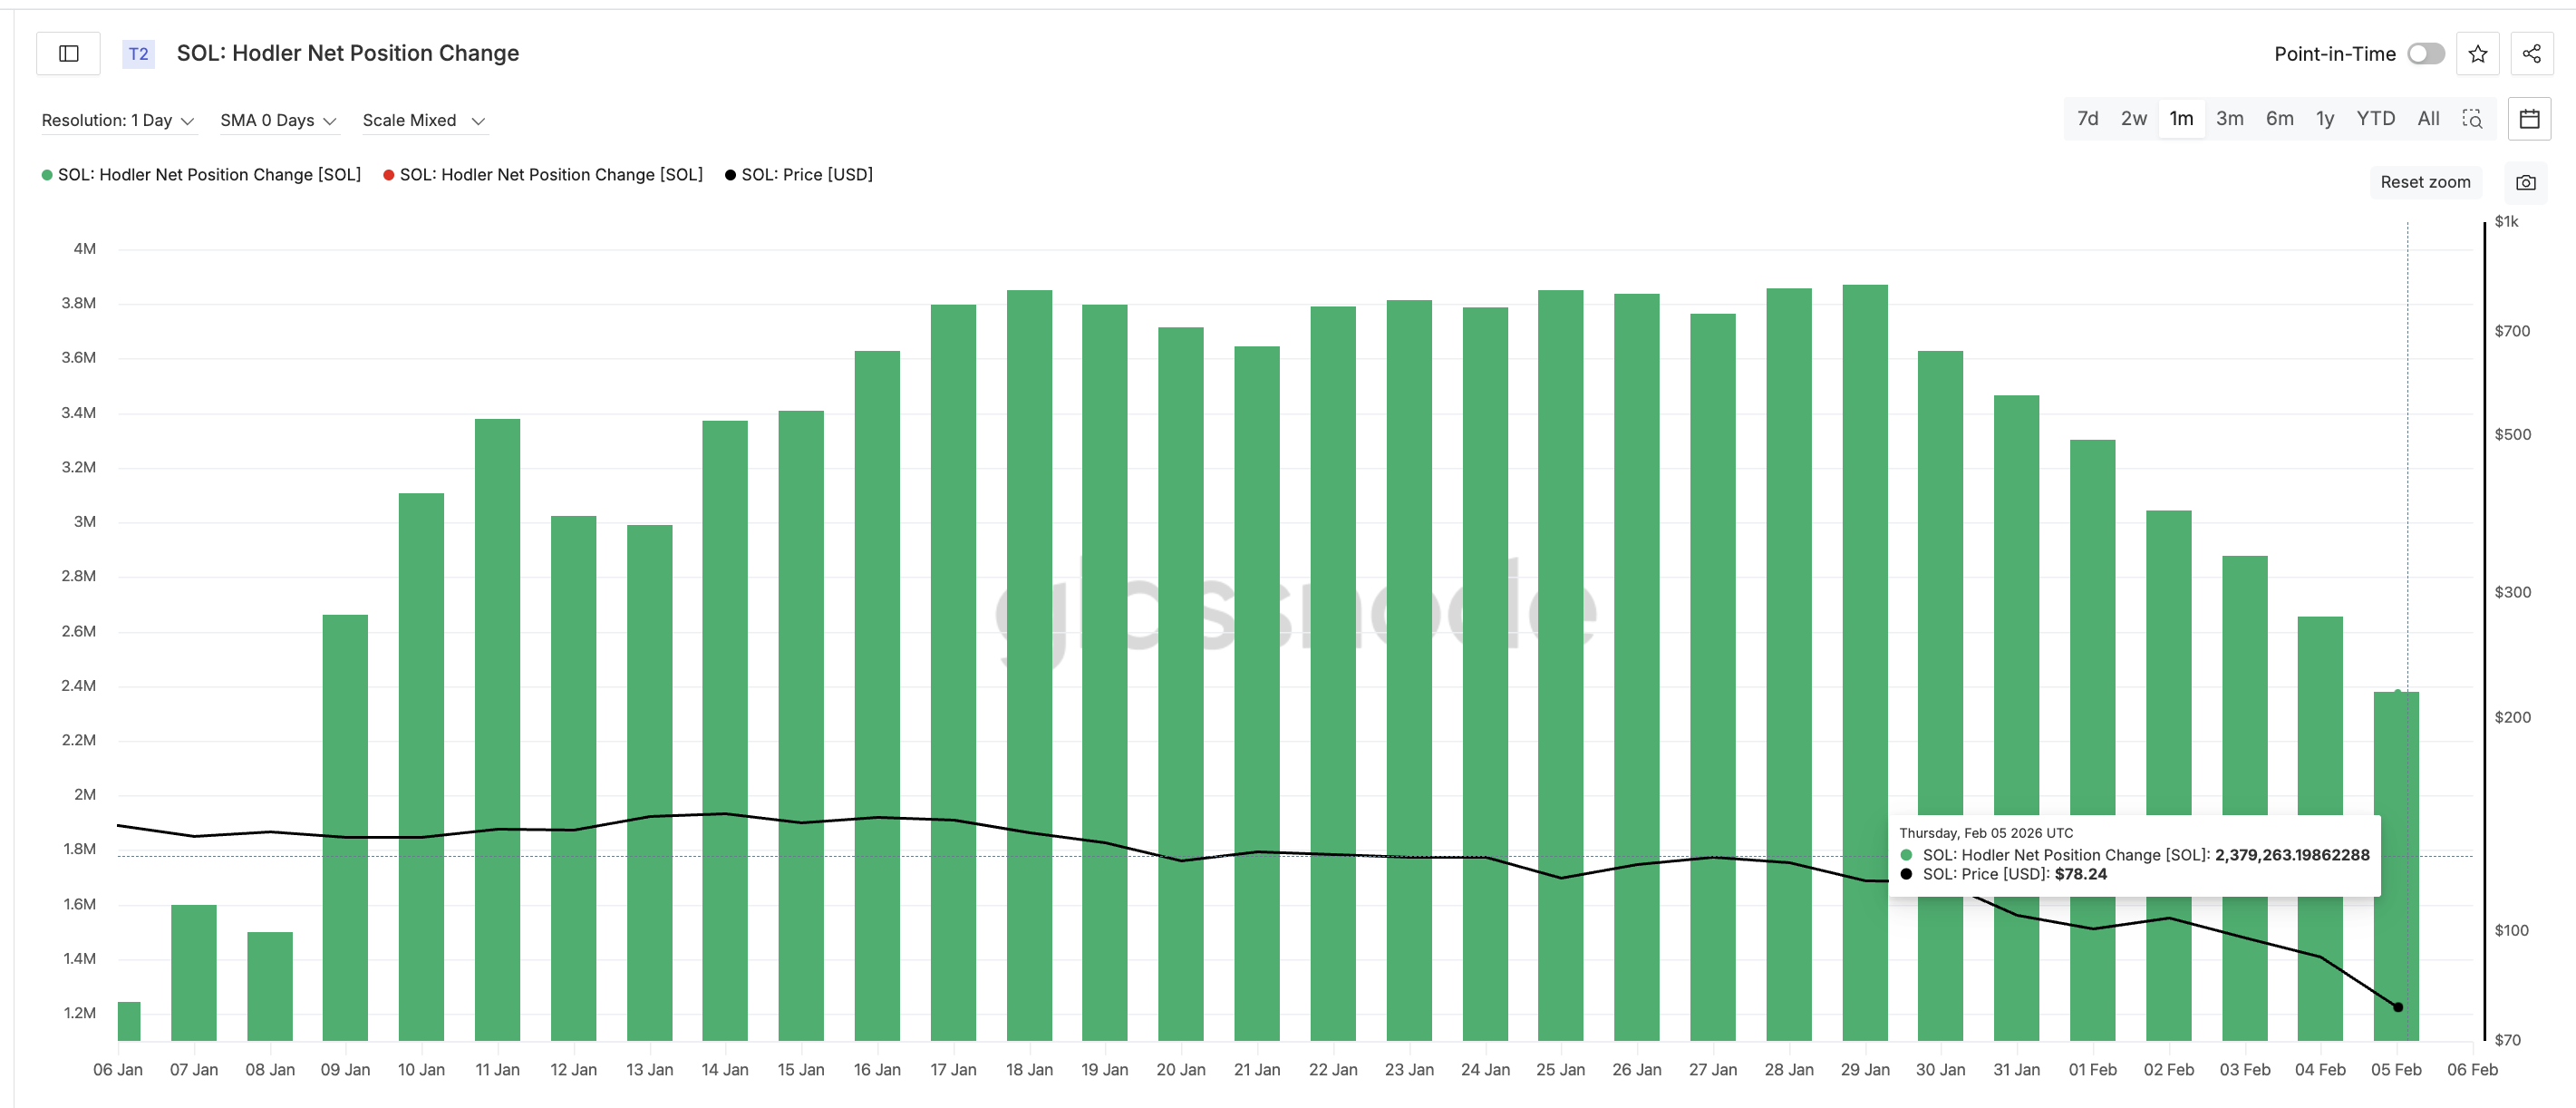
This shows that investors holding for more than 155 days are still distributing rather than accumulating.
When short-term buyers are increasing exposure while long-term holders are exiting, it usually signals weak market conditions. This imbalance suggests that conviction remains weak and that the rebound is not being supported by strong capital inflows.
Solana Price Levels Show Why the Recovery Remains Unproven
Solana’s price structure reflects the weakness seen in on-chain data.
Sponsored
Sponsored
The first key level to watch is $93. Reclaiming this zone would require another move of nearly 19% from current levels and would signal a meaningful improvement in market structure and even Hodler confidence. Without a sustained break above this level, upside attempts are likely to face selling pressure.
Above $93, stronger resistance sits near $105 and $121, where previous breakdowns occurred. These zones would need to be reclaimed before a medium-term recovery could be confirmed.
On the downside, the $67 region remains critical support. This level marked the recent cycle low. A sustained break below $67 would expose the next downside target near $59.
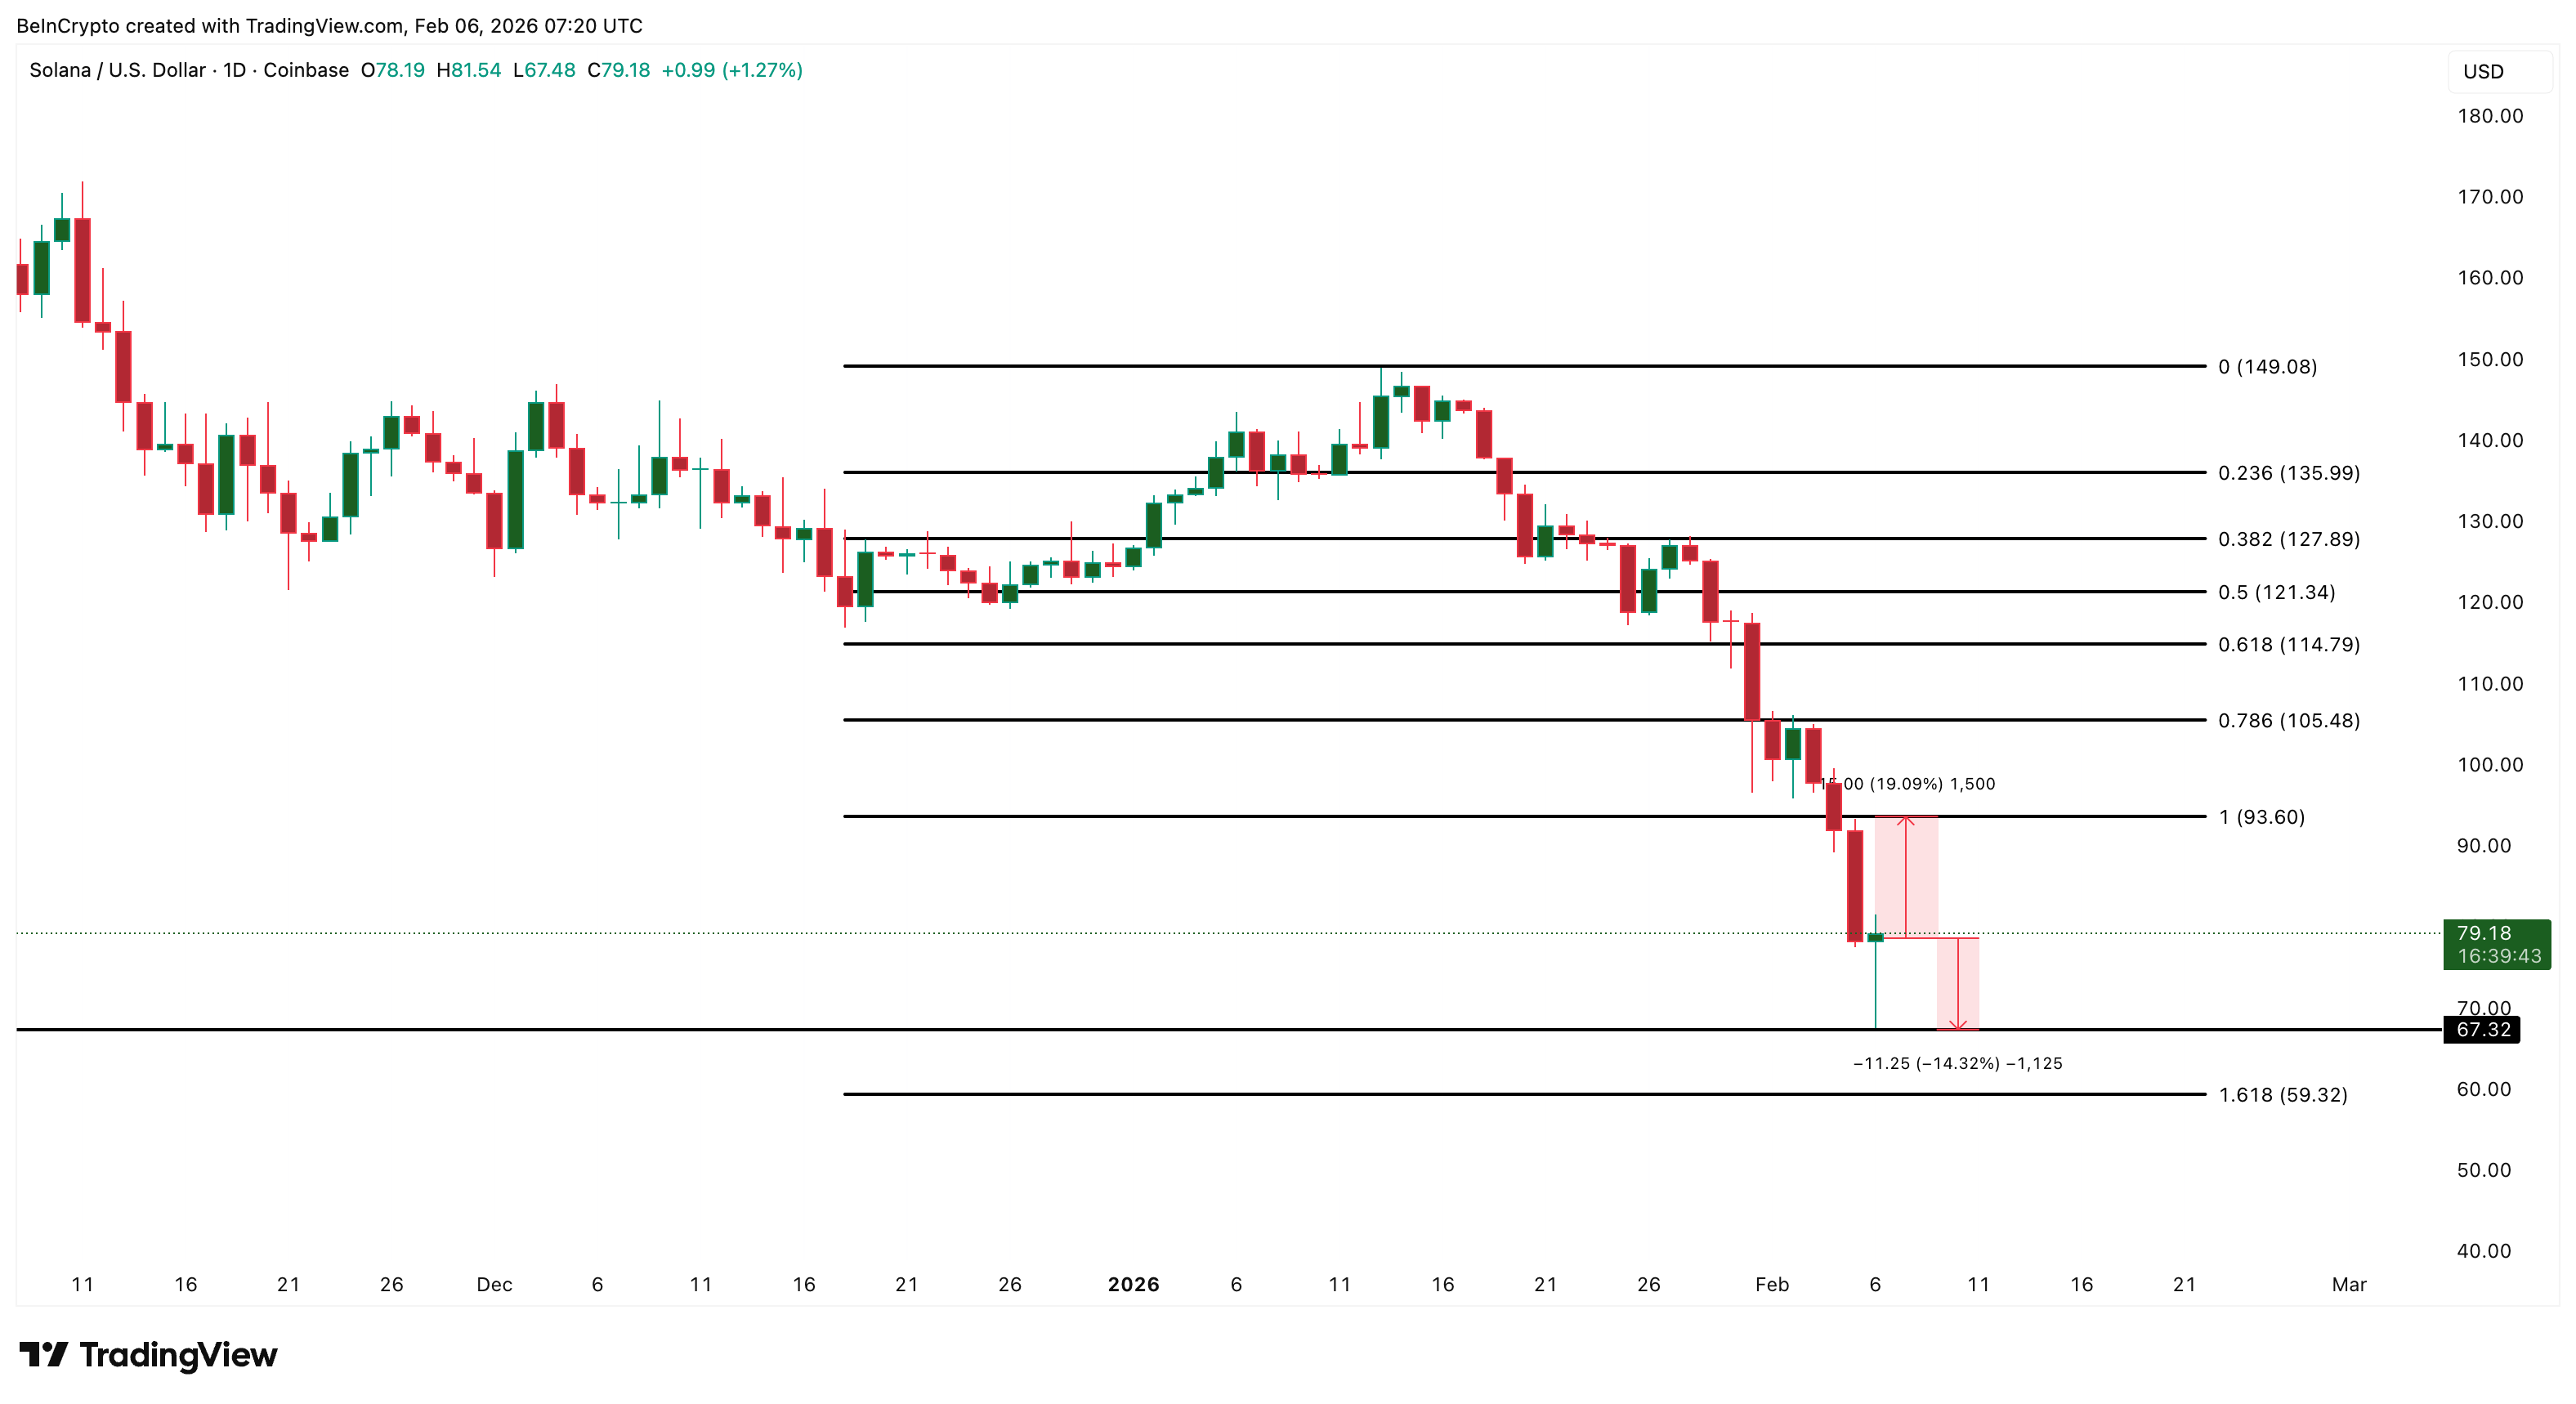
If $59 fails, Solana could enter a deeper corrective phase, bringing lower support zones into play. Such a move would likely be accompanied by further selling from short-term holders and continued distribution from long-term investors.
Until Solana reclaims $93 while long-term accumulation returns and speculative activity cools, the rebound remains technically and structurally weak. Under current conditions, price bounces are still vulnerable to rapid reversals.