
danilovi/E+ via Getty Images
By Brian Levitt, Global Market Strategist
History is comprised of challenging times. As a global market strategist, it’s my job to talk about these historic events in the context of the markets and to offer some perspective for investors. Unfortunately, it’s time to do so once again.
Markets, over more than 120 years, have experienced a long-term advance despite war, recession, oil shocks, political assassinations, and much more. While military conflicts test investors’ resolve to stick to their investment plan, history suggests these events have not derailed the long-term growth of financial markets. I implore investors to maintain a long-term perspective.
Stock market returns following geopolitical conflicts
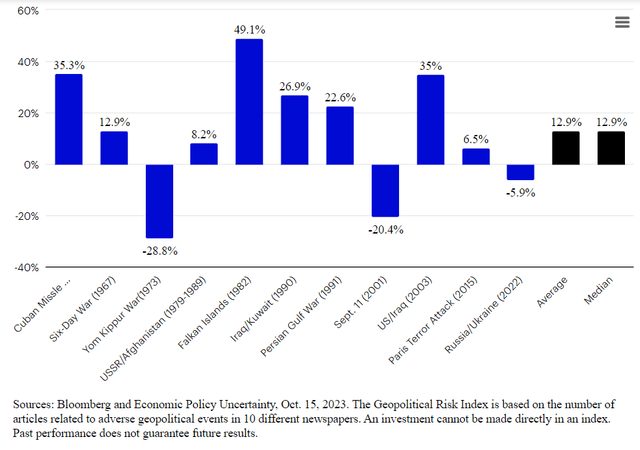
If there’s a factor that impacts market performance, there’s an index to measure it. Geopolitical risk is no exception. The chart below illustrates 11 points in history where we experienced a peak in the Geopolitical Risk Index, and it shows the return of the S&P 500 Index 12 months after that peak. In most cases, the stock market rose significantly in the year following peak geopolitical risk.
Stocks have made significant returns in the 12 months following peak geopolitical risk
S&P 500 Index returns 12 months after a peak in the Geopolitical Risk Index
A closer look at the Yom Kippur War
The biggest outlier in the above chart is the Yom Kippur War in 1973, which was followed by a severe recession and a sharp decline in markets. This may be concerning to investors given the parallels to today’s conflict, but there are very significant differences:
- The 1970s recession was fueled by the Arab oil embargo against the United States. But today, the US is significantly more energy-independent than it was back then.
- In the 1970s, inflation was beginning to rise. But in the current instance, inflation peaked well over a year ago – the US Consumer Price Index hit 9.1% in June 2022, falling to 3.7% in September 2023.1
- The Federal Reserve appears to not be suffering from a credibility gap, as it was in the 1970s. Inflation expectations are very well anchored in the US.
Footnotes
- Source: US Bureau of Labor Statistics, as of Oct. 12, 2023
Important information
NA3172239
Header image: Who is Danny / Adobe Stock
Investors should consult a financial professional before making any investment decisions. This does not constitute a recommendation of any investment strategy or product for a particular investor. Investors should consult a financial professional before making any investment decisions.
All investing involves risk, including the risk of loss.
Past performance does not guarantee future results.
Investments cannot be made directly in an index.
In general, stock values fluctuate, sometimes widely, in response to activities specific to the company as well as general market, economic and political conditions.
The Consumer Price Index (CPI) measures change in consumer prices as determined by the US Bureau of Labor Statistics. Core CPI excludes food and energy prices, while headline CPI includes them.
The S&P 500® Index is a market-capitalization-weighted index of the 500 largest domestic US stocks. The S&P 500 Total Return Index assumes that all cash distributions are reinvested.
The opinions referenced above are those of the author as of Oct. 16, 2023. These comments should not be construed as recommendations, but as an illustration of broader themes. Forward-looking statements are not guarantees of future results. They involve risks, uncertainties and assumptions; there can be no assurance that actual results will not differ materially from expectations.
©2023 Invesco Ltd. All rights reserved
Military Conflicts Haven’t Derailed The Long-Term Growth Of Stocks by Invesco US