 Price Pattern Initiate Reversal?")
The price of Cardano (ADA) has created a bullish triple-bottom pattern but failed to initiate any increase.
There is a distinct lack of momentum after the breakout, causing ADA to fall to its pre-breakout levels.
Will Triple Bottom Pattern Cause ADA Trend Reversal?
The technical analysis from the daily timeframe shows that the ADA price has fallen since its yearly high of $0.46 in April. The decrease led to a low of $0.22 on June 10.
Cardano bounced afterward, creating a long lower wick (green icon) and validating the $0.24 area as support.
After the bounce, the cryptocurrency fell twice to the $0.24 horizontal support area on August 17 and September 11, respectively (green icons). This effectively created a triple bottom, considered a bullish pattern.
However, ADA has not initiated any upward movement despite creating a bullish pattern.
Nevertheless, the daily RSI supports the continuing of the ADA price increase. Traders utilize the RSI as a momentum indicator to assess whether a market is overbought or oversold and to determine whether to accumulate or sell an asset.
If the RSI reading is above 50 and the trend is upward, bulls still have an advantage, but if the reading is below 50, the opposite is true.
The RSI has generated a significant amount of bullish divergence throughout the triple bottom pattern. This occurs when a momentum increase accompanies a price decrease. It is a sign that often precedes bullish trend reversals.
ADA Price Prediction: Short-Term Breakout Can Initiate Reversal
A closer look at the movement shows that the ADA broke out from a descending resistance trendline on September 15.
Even though the price failed to initiate an increase, it is possible that the price is validating the resistance trendline as support. This is a common movement after breakouts.
Therefore, the most likely future ADA price movement is an increase towards at least the $0.31 resistance area. This is both the 0.5 Fib retracement resistance level and a horizontal resistance area. The level is 22% above the current price.
A reclaim of this area will confirm the triple bottom pattern, in turn, also validating the bullish trend reversal.
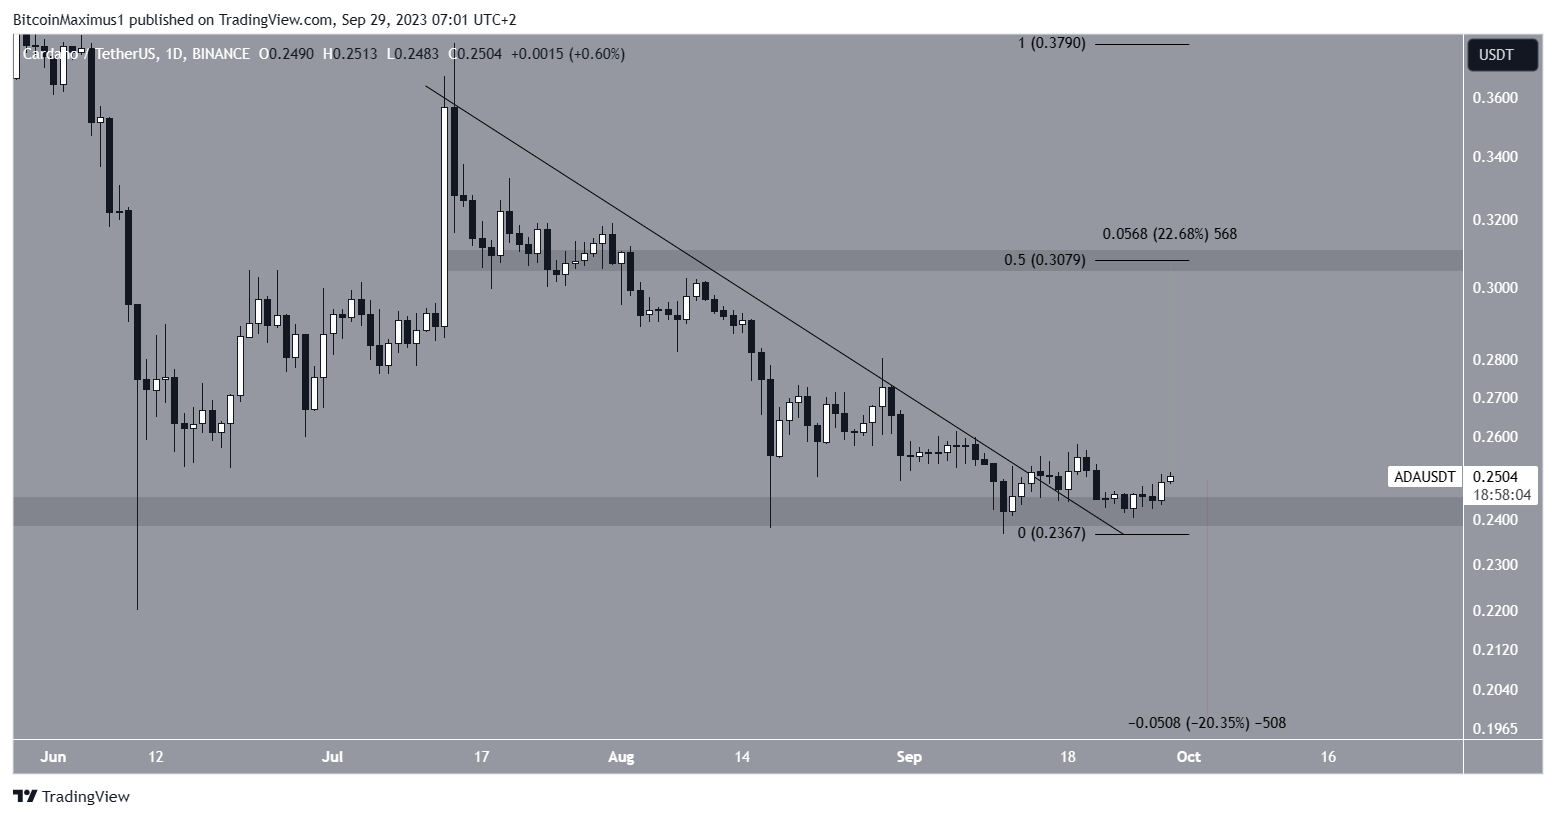
Despite the bullish ADA price prediction, a fall below the $0.24 horizontal area will invalidate both the long-term triple bottom and short-term bullish pattern.
In that case, a 20% drop to $0.20 will be likely.
For BeInCrypto’s latest crypto market analysis, click here.
Disclaimer
In line with the Trust Project guidelines, this price analysis article is for informational purposes only and should not be considered financial or investment advice. BeInCrypto is committed to accurate, unbiased reporting, but market conditions are subject to change without notice. Always conduct your own research and consult with a professional before making any financial decisions.