
franckreporter
Investment Briefing
Energy suppliers are ripe to catch a bid as we tide through a number of macroeconomic factors, each having implications to the cost and profitability of energy supply. Renewables are the wild card in the mix, offering potential differentiation from conventional energy purveyors in terms of pricing and core offerings. ReNew Energy (NASDAQ:RNW) has emerged as one such name, more so with its footprint in the Indian market.
RNW is a provider of renewable energy to the Indian market. Its clean energy portfolio is one of the largest globally. It currently stands at ~13.7 GW of capacity as of June this year. RNW also offers storage and trades in carbon markets. The company listed on the NASDAQ in 2021, and since, it’s equity performance hasn’t lived up to the hype, despite finding a bottom earlier in the year (see: Figure 1).
This report will unpack all of the moving parts in the RNW investment debate and link this back to why I believe it’s a hold for now. Whilst there are compelling arguments for the company’s competitive position, I’m not seeing this pull through to the economics to say it’s a screaming buy. Net-net, rate hold.
Figure 1.
Data: Updata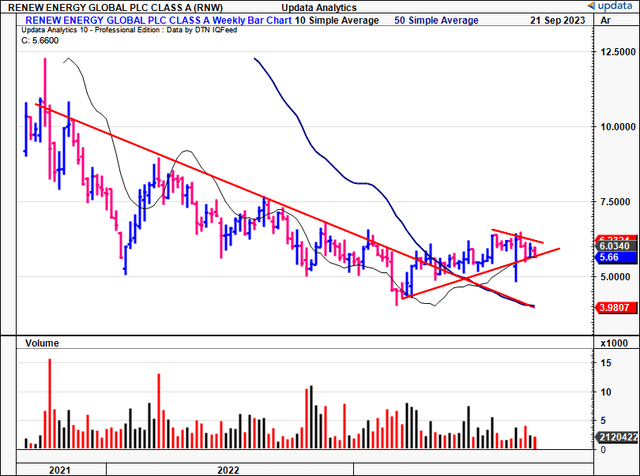
Dive into Indian renewables market
India’s renewable energy market has undergone remarkable growth and transformation over the last decade, driven by several critical factors, including (i) government policies, (ii) its global climate commitments, and (iii) economic dynamics. India had set ambitious targets of achieving 450GW of renewable energy capacity by 2030, focusing on solar, wind, and hydroelectric power. It is projected to grow at CAGR 7.3% into 2028.
Primary renewables sources
- Solar power has emerged as the leading renewable energy source, contributing significantly to the country’s total renewable energy capacity. India is a sunny place, and the abundant sunlight, coupled with declining solar panel costs, has accelerated the adoption of solar energy. Both utility-scale and rooftop photovoltaic projects are capturing investment.
- India also has a well-established wind energy sector, and the country is among the largest wind energy producers worldwide. Technological advancements in wind turbines and supportive policies have encouraged further expansion. Coastal regions are also exploring offshore wind projects due to their potential.
- Given India’s diverse geography, hydroelectric power plays a crucial role in the country’s renewable energy mix. The government has put its focus on enhancing hydroelectric efficiency and is exploring pumped hydro storage.
Economics and investment flows
The cost of solar and wind energy technologies is decreasing, making them increasingly competitive with conventional fossil fuels. In India, this has resulted in record-low tariffs in solar and wind auctions, driving investment to the sector.
Government initiatives such as ‘Make in India’ and ‘Atmanirbhar Bharat‘ have also promoted domestic manufacturing. So the base is there for its renewables industry to grow competitively in my opinion.
Critical insights from investment facts pattern
Q1 FY’24 takeouts
[Note: as a reminder, RNW reported its first quarter fiscal ’24 results. This corresponds to Q2 CY 2023. For simplicity and consistency, I’ll talk in terms of 2024 from here. As a further reminder, all figures are quoted in USD, at the cross rate at the time of RNW’s reporting].
In its Q1 FY’24, RNW clipped total revenue of ~$300mm, which decreased from $305mm last year It pulled this to adj. EBITDA of $227mm on earnings of c. $36mm, compared to a net loss of $ 1mm in Q1 ’23.
As to the unit economics, note the following:
- RNW sold ~5.1Bn kWh of electricity during the quarter, a decrease of 1.4% YoY.
- Regarding the split, sales of electricity from wind assets decreased by 8.8% YoY, while the sales of electricity from solar assets increased by ~9%.
- Electricity sales from hydro assets decreased by ~9% YoY.
Figure 2.
Source: RNW Q1 FY’24 Investor Presentation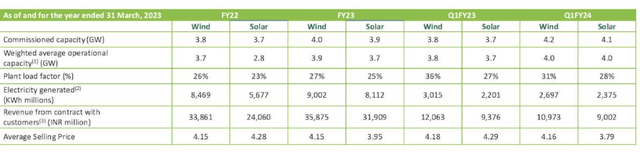
A point to consider is that RNW’s operating portfolio has grown significantly since ’22. It reached 8.4 GW in Q1, an increase of 47% compared to its Q1 ’22. Installed capacity has also increased 10% from 7.6 GW to 8.4 GW in the last 12 months. At the end of June, RNW’s portfolio comprised 13.7 GWs, with around 8.4 GWs of this commissioned and the remaining 5.3 GWs firmly committed.
Figure 3.
Source: RNW Q1 FY’24 Investor Presentation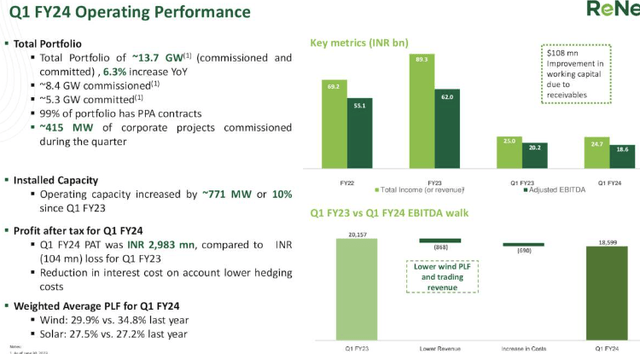
Looking ahead, RNW plans to commission between 1.3—1.7 GW of projects during the remainder of the fiscal year. The company’s Peak Power and RTC projects are expected to be significant contributors to growth, and management projects EBITDA growth of >35% in its fiscal ’25, and it aims to reach target commissioning guidance of 1.75—2.25 GW by the end of FY’24.
Analysis of economic performance
In the utilities sector, especially in energy, lack of differentiation is a major challenge. Providers struggle to stand out in terms of cost, product offerings, and branding, leaving few apparent consumer advantages for suppliers. Most providers are subject to similar pricing mechanisms and are indistinguishable given they are all selling energy and so forth. This is similar to commodity producers, where there is no cost differentiation/cost leadership, so the key insulators are factors of production and efficiency. Consequently, the economic characteristics of each company become crucial in identifying those with the competitive position.
Renewables provide a potential antidote to this conundrum. The interplay of tendering and offtakes is different to the traditional energy sector, so there’s scope to see higher post-tax margins along with capital turnover, potentially increasing the competitive advantages of the sector.
Figure 4 depicts RNW’s cash conversion cycle (“CCC”) and days sales outstanding (“DSO”) on a rolling TTM basis since ’21. The company listed in that year, but we have data dating back to FY’20. Critically, the trailing CCC has tightened by ~150 days from 2022 to ’23, coming in at 51 days during RNW’s Q1 on DSO of 102 days. At this rate of conversion, it could turn over its NWC 6.3x a year given the average of the last 2 quarters (assuming a 365 day year).
BIG Insights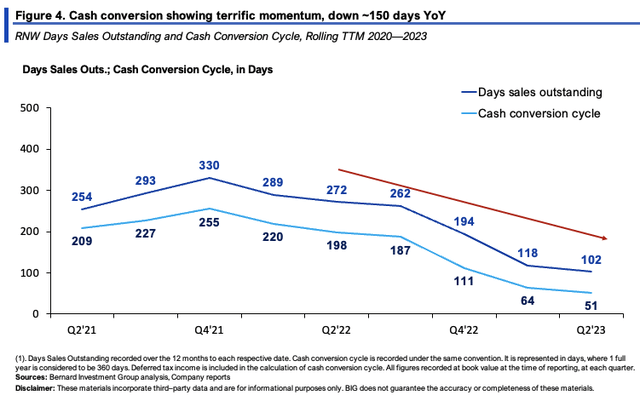
The rate of return produced on RNW’s capital investments is what I’m most interested in. In Figure 5 you can see it had put $8.2Bn or $22.30/share at risk in the business by Q1. This produced $509mm or ~$1.40/share in trailing post-tax earnings, only 6.2% return on investment, in line with historical averages. The returns on new capital deployed aren’t a saviour here, down 6% in the TTM, and just 3% in the December period.
But there’s a key takeout here, and it relates to what I was talking about with differentiation and so on:
- RNW’s post-tax margins are remarkably high, coming in at 54% in the TTM. At the same time, capital turnover is statistically low, at 0.11x of sales constantly.
- This squares off with the economics of the business in my view. For one, renewables are not yet widely adopted. So it’s unlikely to see capital behaving efficiently. Relatedly, replacement units haven’t been called for on existing placements at critical mass.
- But what is intriguing is the marginal difference in renewable energy supply and conventional energy supply. Compare this to ONE Gas (OGS) for example, a name I recently covered. It is running ~12% post-tax margins, ~0.4x capital turnover, ~4–5% return on capital. The difference at the margin is staggering here, raising the question—does RNW enjoy consumer advantages with its offerings? More likely in my view, is the cost differentiation factor, in that renewables are simply more expensive right now than conventional energy supply, feeding more down the P&L for RNW. Still, these are very compelling economics, should the company improve its capital efficiency numbers.
BIG Insights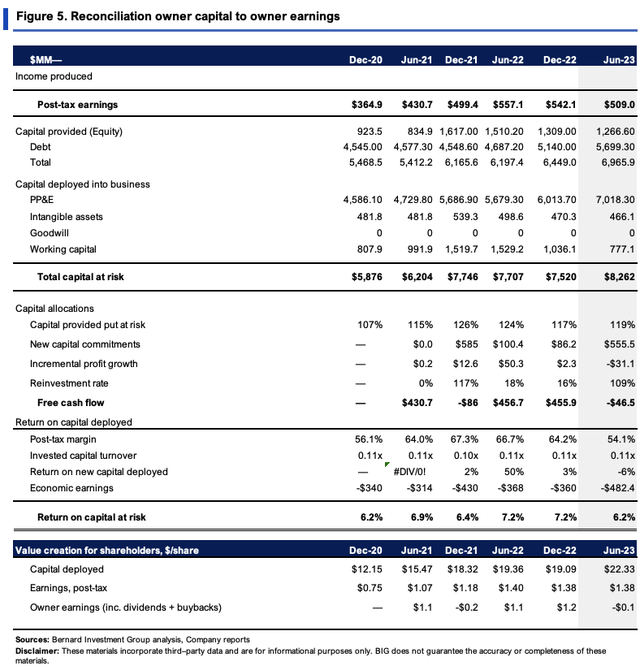
As mentioned earlier, I’m tasked with benchmarking companies against their propensity to compound capital at above-market rates of return. We consider this 12% in our equity holdings, reflecting long-term market averages. So RNW is producing a series of economic losses using this convention. Figure 6 outlines this in granular detail. At an $8.2Bn investment, the TTM post-tax earnings it would need to produce at a 12% charge is $991.4mm, whereas it did $509mm in Q1. The ensuing economic loss per share was $1.30. Economic profits are undoubtedly preferable.
BIG Insights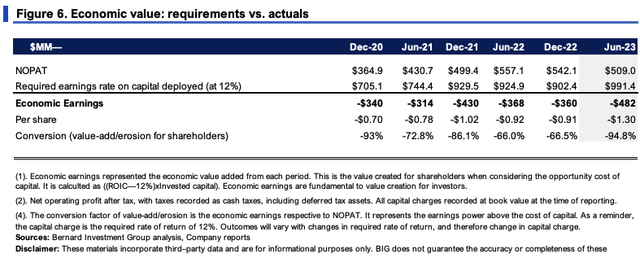
Expectations at steady-state operations
RNW’s operating drivers since 2020 are noted in Figure 7. As mentioned, we have data going back to 2020 for the company. Revenues have compounded at 3.8% on very attractive operating margins. Naturally, the bulk of capital allocation has been toward fixed capital, whereas NWC requirements have narrowed. For every new $1 in sales, RNW invested $8.30 towards its fixed asset base.
BIG Insights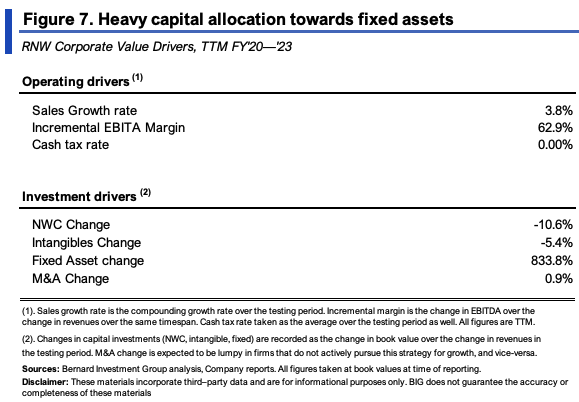
Carrying these assumptions forward is quite telling. Management are projecting ~$2Bn in CapEx for its FY’24. If it maintained the steady state shown above, it would fall short by ~$500mm. To hit that level of investment either needs to either:
(i). Increase revenue growth and maintain the same rate of fixed capital investment, or
(ii). Up the capital allocation towards fixed assets regardless.
Figure 8 shows the capital requirements at a constant 4.5% revenue growth rate, not far ahead of consensus estimates. Here it would need to invest ~$2Bn for the year into its CapEx programs, ~$350–$420mm per quarter, equating to ~60% of the trailing NOPAT each rolling period, or >100% of the prospective FCF each period.
BIG Insights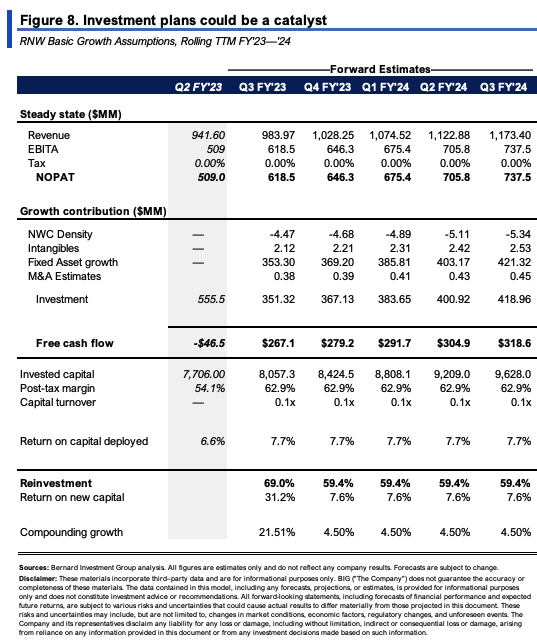
Valuation and conclusion
The stock sells at 15x forward EBIT and has only created $1.80 in market value for every $1 in net asset value thus far. As you can see in Figure 9, it trades at a discount to capital invested. In other words, the market doesn’t value RNW’s assets very highly at all, in terms of their earnings power moving forward. In fact, considering the capital productivity, it may well be the market has RNW priced correctly at its current marks.
Source: BIG Insights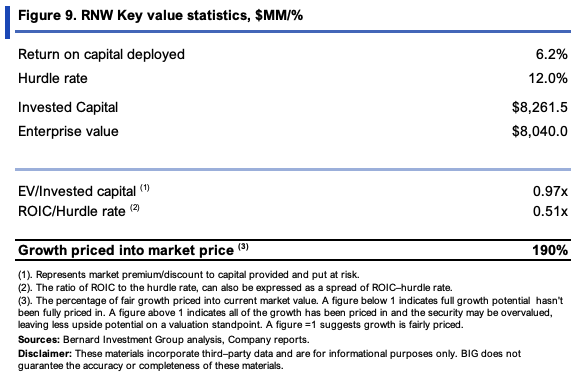
Compounding the firm’s equity value at the numbers shown in Figure 8, as the function of its ROIC and reinvestment rate, I get to $7.28/share in implied equity value for the company. This level is supported in technical studies as well, as seen in the P&F study in Figure 11. In percentage terms, this is 28% potential value gap. But in reality, it’s $1.60 in capital appreciation per share, so a large position size would be required to take this on in my view, something I’m not committed to with the risk profile at play.
Source: BIG Insights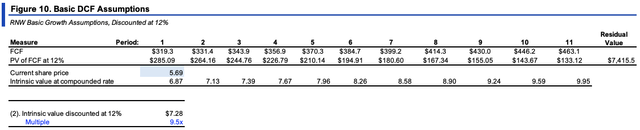
Figure 11.
Data: Updata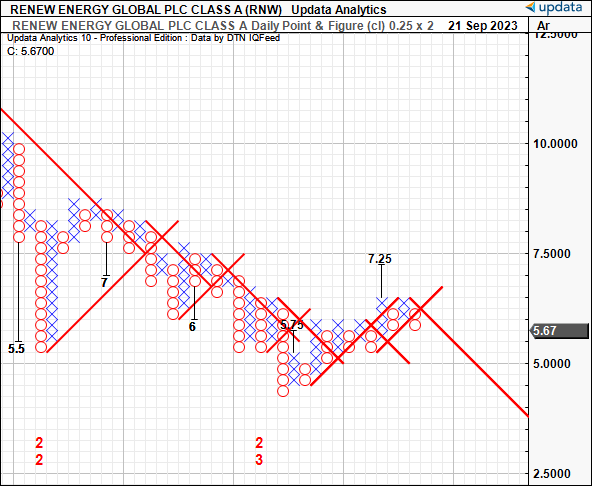
In short, there are compelling arguments to make in the investment debate for RNW. Chief among these are the core offerings in renewables. Second to this are the high post-tax margins it produces on ~$8.5Bn of capital at risk, contrary to traditional energy suppliers. It will be investing heavily for growth going forward, too. But the flip side is capital productivity is low for RNW. This is a high-margin, low capital turnover business, that has tremendously high reinvestment requirements to maintain its competitive position. I’ve estimated it needs to invest $8 for every $1 in new sales at a 4.5% revenue growth rate to maintain competitive and hit its internal CapEx targets. Trouble is, the follow-through on earnings from this is unattractive, throwing off 6–7% rates of return on a rolling TTM basis. Money can be compounded at more attractive rates elsewhere at this point in time, with much lower risk in my view. Net-net, rate hold.