
photoman/iStock via Getty Images
The payout ratio is a good indicator of dividend sustainability. Let me explain how to use payout ratios wisely when assessing companies as investments possibilities or investments to sell.
Payout ratios in a nutshell
There are different ways to calculate a payout ratio. The simplest way is the classic payout ratio.
Essentially, it tells you how much of its earnings per share a company uses to pay dividends. Another widely used calculation is the cash payout ratio.
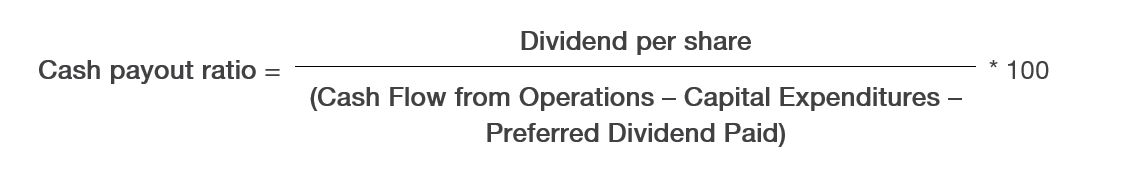
While a bit more complicated to calculate, the cash payout ratio gives a clear picture of the company’s ability to use its cash resources to pay their dividend. It’s more precise than using only earnings, like the classic payout ratio does.
There are other payout ratios whose formulas make them more appropriate for capital-intensive companies like pipelines and utilities, or for REITs.
Simple interpretation of payout ratios
Many investors like to keep things simple when they use the payout ratio to determine if a company can afford to share the wealth with its shareholders. This is how they interpret payout ratios:
- If the payout ratio is over 100%, the company is paying more in dividends than it makes in profit (classic payout ratio) or more than the cash it generates (cash payout ratio).
- If the payout ratio is negative, the company has negative earnings (EPS), therefore it’s losing money.
- Both of these are bad and point to a dividend at risk.
- Ideally, you want to see a payout ratio in the 75%-80% range.
That’s simple all right, but also incomplete, and often wrong! A payout ratio provides useful information, but you can’t take only the number from a stock screener or financial site and draw an educated conclusion.
Trends, context, and details
When a payout ratio is “bad”, meaning over 100% or negative, it’s important to look at the trend of the payout ratio. Was it bad for every quarter for the last year? Was it often bad in a 5-to-10-year range? Does it vary seasonally? Is the bad ratio a trend or an anomaly?
If the bad payout ratio stands out, i.e., it is unusual for a company, it’s an anomaly that can perhaps be explained by a temporary setback or one-time event. Examples include:
- Having to pay a single big bill perhaps to settle a lawsuit or perform a product recall.
- An accounting impairment, such as an adjustment of the fair value of assets like property.
- A natural disaster halting production or wrecking a production facility.
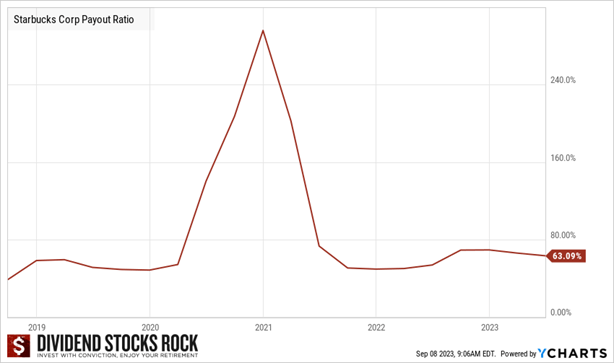
- Mandatory closure due to a pandemic, is precisely what happened to Starbucks’ (SBUX) payout ratio, as shown below. It was temporary, and the ratio went back to its usual level quickly. The dividend was not in severe risk.
If the trend shows a bad payout ratio consistently or frequently, you might have cause for concern, but you could dig a bit more by looking at the company’s dividend triangle and consulting its quarterly reports.
Capital-intensive businesses
We often see bad payout ratios for capital-intensive businesses because of their heavy non-cash items like depreciation, which don’t affect the amount of cash available to pay dividends, and their large capital expenditures (CAPEX), which they use to generate revenue and profit in the future. These items are included when calculating EPS, which can lead to a poor classic payout ratio.
We will often see a negative cash payout ratio for such companies because they finance their CAPEX through a combination of cash flow from operations, debt, or share issuances.
Since the calculation of the cash payout ratio includes CAPEX but disregards debt and share issuance, it can be negative, giving the impression the company must be using debt to finance its dividend.
Differences between industries
What is a good payout ratio varies across different industries. For example, Canadian banks target a payout ratio in the 45%-50% range, and the trend is similar among utilities. Other industries gravitate to lower or higher ratios.
Many tech companies keep low payout ratios because they focus on growing their business rather than distributing most of their earnings. Look at Apple’s (AAPL) payout ratio of 15% and dividend yield of 0.5%, or Microsoft’s (MSFT) payout ratio of 28% and yield of 0.8%.
Other companies’ payout ratio follows economic cycles as they continuously increase their dividend. 3M (MMM) has increased its dividend every year since 1959. However, its payout ratio varies, rising to the 75-80% range during economic slowdowns.
Use payout ratios wisely: My approach
As you can now more fully appreciate, a single metric leads to questions and further calculations. While the payout ratio is a good indicator of dividend sustainability, using it exclusively is not the way to go.
At DSR, we first look at the company’s dividend triangle. The revenue and earnings trends say a lot about the company’s ability to increase its dividend in the future.
You rarely find dividend growers with weak revenue growth and poor earnings increases. The dividend growth trend will confirm the analysis.
Then, and only then, we look at the company’s payout ratios. We consider both the dividend payout ratio and the cash payout ratio when they are available. Ideally, we focus on companies with payout ratios under 80% and investigate further when ratios are too high.
To investigate, look at the company’s quarterly earnings – usually press releases and investor presentations are enough – to find plausible explanations for the high or negative payout ratio.
Most companies issue a statement about continuing to reward their shareholders. You shouldn’t have to search extensively to get a clear picture of a company’s ability and willingness to do so.
Editor’s Note: The summary bullets for this article were chosen by Seeking Alpha editors.