
Aaron Davidson/Getty Images Entertainment
Thesis
Leading U.S. energy stocks like Exxon Mobil Corporation (XOM) and Chevron Corporation (CVX) have delivered strong returns recently (see the first chart below). To wit, they have delivered total returns of 12.58% and 8.17%, respectively). In contrast, the leading energy stocks from our northern neighbor went in the opposite direction as seen. To wit, the main topic for today, Suncor Energy Inc. (NYSE:SU), suffered a loss of 5.85%.
Against this backdrop, my thesis here is to argue why SU looks more attractive than its U.S. peers under current conditions. The key considerations are strong cash flow, capital allocation flexibility, and a large value-price gap. The company has such a robust cash flow that it can reinvest aggressively to fuel future growth, reward shareholders generously, and pursue bolt-on acquisitions all at the same time. For example, it made an offer to acquire TotalEnergies’ Canadian operations (Total Canada) in April. If the deal goes through, it will further consolidate its leading position. In the meantime, due to the recent price divergence compared to its U.S. peers, the investment now offers favorable odds for price appreciation in addition to the generous payouts.
These considerations reminded me of a comment Shark Tank’s Kevin O’Leary made about energy stocks in early 2023. His comment is quoted below. His thesis has worked out beautifully in the U.S. market so far. Next, I will detail why I see SU demonstrating all the traits that O’Leary praised above. Then I will go a step further to also examine on its growth potential and valuation discount.
“I love energy. Everybody hates energy… Go where people hate it. Energy is the driving pivot.” O’Leary said. “The cash flow, the distribution… that sector is looking golden right now.”
Source: Seeking Alpha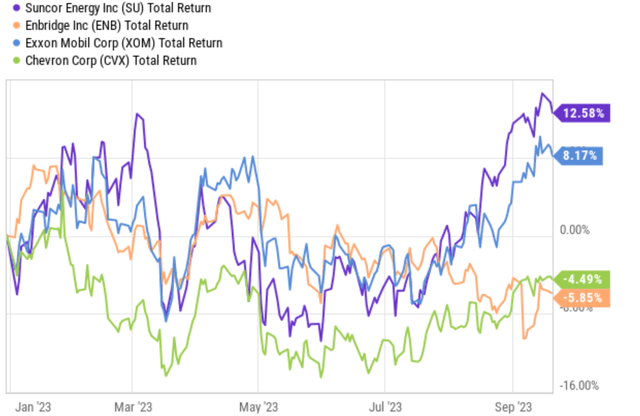
Healthy cash flow to reinvest and reward shareholders
Thanks to several favorable tailwinds, SU currently enjoys strong profitability. As you can see from the following chart, both ROIC (return on invested capital) and margins are far above the historical average. The top tailwinds in my view are the underinvestment in oil production in recent years, the strong recovery of oil demand after the COVID pandemic, and also the geopolitical instability (e.g., in Ukraine and Russia) that interrupted oil production. I do not see any of these factors to change in the near term and thus expect the favorable pricing environment to persist.
Source: Seeking Alpha
Thanks to these profitability tailwinds, SU enjoys a strong cash flow to reward investors and pursue growth at the same time (see the next chart). The stock pays a 4.45% FWD cash dividend yield. However, the cash dividend yield is only half of the equation here. Readers familiar with my approaches know total shareholder yield is more meaningful. As shown in the bottom panel of the chart, SU has been a regular buyer of its own share in the past, a very good sign. And the net common buyback yield was about 5.01% in the past 10 years. As a reflection of the strong profitability in the past 1~2 years, the company cranked up the buyback yield to more than 9%. Currently, the buyback yield sits at 5.49%, about 10% (in relative terms) above the historical average. I always prefer share buybacks over cash dividends for reasons detailed in my other articles. The gist is:
I can always sell some shares (to take advantage of the share price appreciation created by the repurchase) and effectively pay myself the amount of dividend that I need. This way, I have better control over the timing, amount, and tax issues. Speaking of tax, it’s really the one thing that you and I can truly control – everything else in investing always involves an element of uncertainty that lies out of our control.
Thus, its total effective yield is close to 10% currently, consisting of 4.45% of FWD cash dividend and 5.49% buyback yield. While in the meantime, the company still has plenty of capital allocation to pursue growth. As seen, it has been aggressively increasing its CAPEX expenditures in the past 2~3 years. The current CAPEX hovers around $4.2B, compared to a bottom level of $2.6B in 2021 and a long-term average of $3.75B.
Source: Seeking Alpha
Growth potential and valuation compression
Given the robust reinvestment discussed above, I see a favorable outlook for EPS growth in the next few years. Furthermore, the sizable share buybacks would add another driver to boost ESP (especially at the current compressed valuation to be detailed in a moment). The consensus estimates seem to share such a view of healthy organic growth. As seen in the chart below, they predict an EPS growth of $3.79 in 2023 to about $4.23 two years later, translating into an annual growth rate of about 6%.
Source: Seeking Alpha data.
Despite the strong profitability and favorable growth, the stock currently is trading at a very compressed valuation both in absolute and relative terms. In absolute terms, its P/E is in the single-digit range as seen above. In relative terms, its valuation multiples are both below its U.S. peers as aforementioned, and also substantially below its own history averages. As shown in the chart below, its EV/EBITDA multiple is only 3.8x, compared to a historical average of 5.6x and XOM’s 5.2x.
Source: Seeking Alpha data.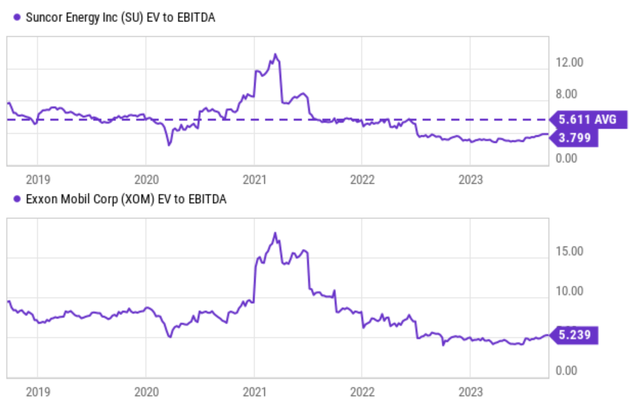
Its stock price as of this writing (about $34.5) is about 7% below its 52-week peak of $37. As you can see from the chart below, even at the 52-week peak price, the stock is still undervalued and offers a substantial margin of safety both relative to its U.S. peers and also its historical average. To wit, the FW EV/sales ratio would be 1.71x at that price, compared to an average of 1.99x in the past 10 years. The FWD EV/EBITDA ratio would be 3.61x at that price, compared to the average of 5.61x just mentioned.
My return projections are also shown in the last column of this table. My projection is made based on a few assumptions. First, I assumed the company would further reduce its total debt, to a level of around $10B, in the next 2~years considering the ample cash flow it generates. For EPS, I took the consensus estimates quoted above. And finally, for valuation, I assumed a reversion to bring the EV/EBITDA multiple close to its historical average. Under these assumptions, my analysis pointed to a target price of around $60 as seen.
Source: Author Using Seeking Alpha data.
Risks and final thoughts
Potential investors need to be aware of the risks too. In the near term, oil prices can be highly volatility as geopolitical situations are quite volatile themselves. In addition, high oil prices often do not stay as a purely economic issue and can evolve into a political issue. Government interference via tax policies and import/export controls can have unpredictable impacts on SU’s near-term earnings. In the long term, the transition to clean energy is LIKELY to lead to a decline in demand for oil. The keyword is likely. As argued in my previous articles, I see plenty of reasons why demand for traditional energy can keep growing despite the rise of renewables.
All told, my overall conclusion is that SU looks much more attractive than its U.S. peers under current conditions. As analyzed in the second session, SU embodies the traits that made O’Leary love energy stocks (strong cash flow and generous payouts) plus a few other important positives. In particular, the company has capital allocation flexibility to ramp up capital investment, buy back shares, and pursue acquisitions at the same time. Finally, a large value-price gap creates good odds for price appreciation on top of dividend and buyback yield. These positives easily outweigh the potential risks.